IN THIS ARTICLE
In this blog post, we’ll show you how to build an IoT coffee maker level monitor that streams how much coffee is in the pot to a realtime web and mobile UI. This project combines an off-the-shelf digital kitchen scale with an Atmel ATmega328p microcontroller and ESP8266 for WiFi connectivity, and then publishes the state of a coffee pot on the scale using PubNub. Our interface uses the EON framework to visualize the volume data in realtime.
We have the coffee pot running right now! Check it out in action on the live UI here.
Picture this. You’ve had a bit of a rough morning, you’re on your way to work, and you can’t decide if you should stop at the corner Coffee Shop for your morning pick me up or just get it from the pot at the office.
 You make it to work, but Bob in accounting is talking your ear off about the pigeons on the sidewalk, and your bladder has suddenly decided to make visiting the restroom a top priority. Even still, you need that cup of joe!
You finally make it to the break room, only to find an empty pot sitting on the warmer. The machine is on. Dirty mugs are in the sink. Everyone else has their energy boost, but someone finished the coffee without refilling the pot. Embrace defeat; it was inevitable.
Then again, maybe somebody was nice and started a fresh brew, but it won’t be ready for a while. Either way, this scenario could have gone a lot differently if you’d just had a way to check the coffee level before you got to work, or at least before you decided to endure all of Bob’s endless ramblings. Well, lucky for you, we live in the dawning of the Age of IoT, and information of any kind is just a simple publish and subscribe away…
Check out this live demo to see it in action!
Project Overview
You’ll need the following:
- Digital Kitchen Scale: Any kind with an LCD screen should work.
- Microcontroller with I/O and WiFi: I am using the ESP8266 in combination with an Atmel ATmega328p MCU.
- PubNub: We’ll use PubNub pub/sub messaging to stream data between our scale and the web UI.
- Source Code and Schematics: all the source code and schematics are open source and available on GitHub in our full repository.
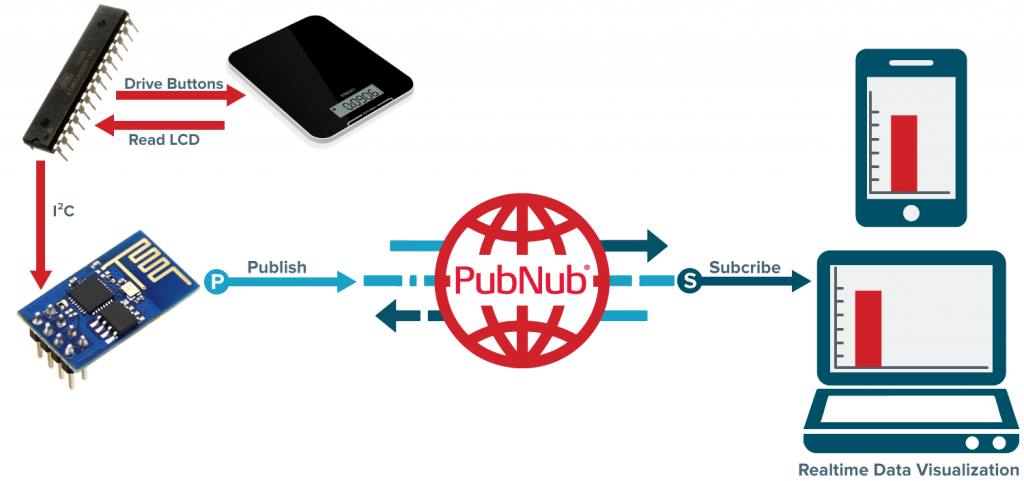
Taking a step back, the whole project works like this. The scale collects measurements and displays information on its LCD screen. That data is read directly by the ATmega328p. In realtime, the data is shared to the ESP8266 on the I2C bus, which then publishes that data to the any user subscribed to the channel (ie. the UI) via PubNub.
The Hardware
Part 1: Using a Digital Scale as a Sensor
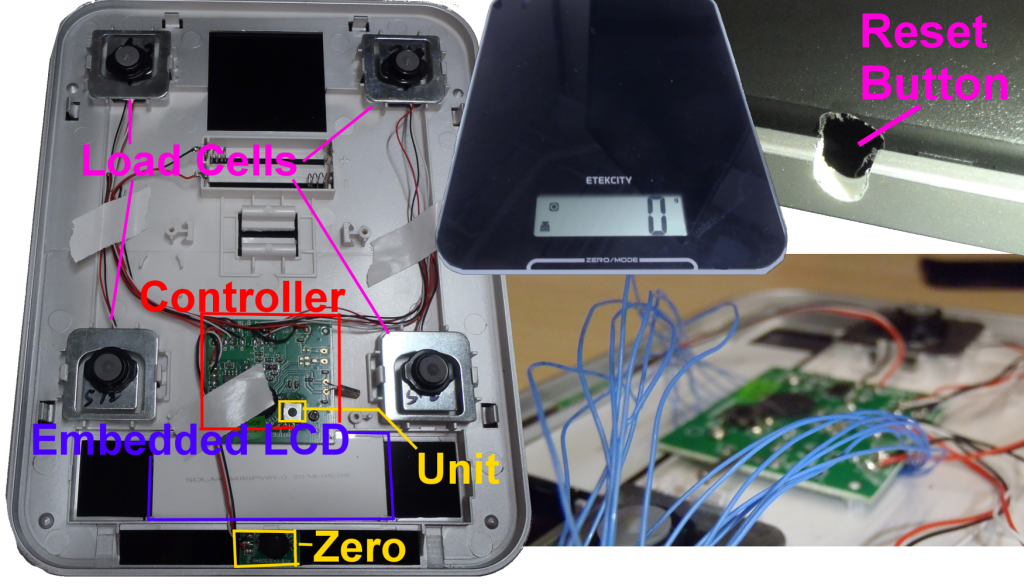
The more embedded circuitry has gotten, the smaller it has become. This is great for most things, but not so much when trying to hack into a device. In the past, there would have been various chips and components from which data could be obtained. This is no longer the case – my digital scale reads four load cells and drives an LCD with a single chip covered in mystery goo. The only other chip on the board is for external EEPROM. If only we could read that LCD screen…I think this hack just got a bit more complicated!
FUN FACT: Those black blobs seen on circuit boards are the product of chip-on-board electronic packaging where dies are bonded directly to a board and coated in a resin. You can learn more about this process here.
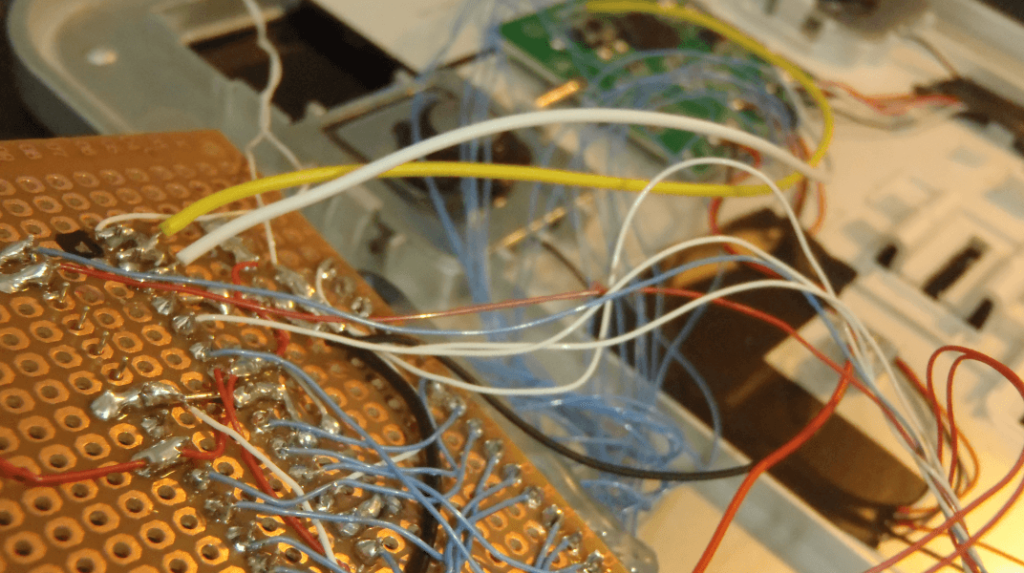
In order to read the LCD, individual wires were soldered to each LCD pin via pads on the PCB. The solder joints need to be positioned such that the LCD makes complete contact with the PCB or the screen will not display correctly. I also wired lines directly onto the board so my control circuit can directly drive the mode buttons on the scale. Lastly, a hole was drilled through the case in order to add a reset button for circuit.
Driving an LED or even a seven segment display is fairly trivial, but directly driving a segmented LCD screen is fairly complex. Atmel gives a great explanation in how it works in this App Note.
Essentially, a few common lines are used for signaling with timed AC pulses. All of the other segments are then turned on by being out of phase with the common lines, or off by being in phase with the common lines. A single LCD line can control as many segments as there are common lines, with control dictated by which common line is active at that time. This process is tricky enough, but we don’t want to drive an LCD, we want to read one that is already being driven. Take caution; some serious product hacking is about to take place!
It would be nearly impossible to figure out the LCD signaling without some way of reading the individual pins. For this I am using the MSO-19 from Linked Instruments. An oscilloscope is preferred, but I was able to do it using only a logic analyzer and some clever trigger thresholds.
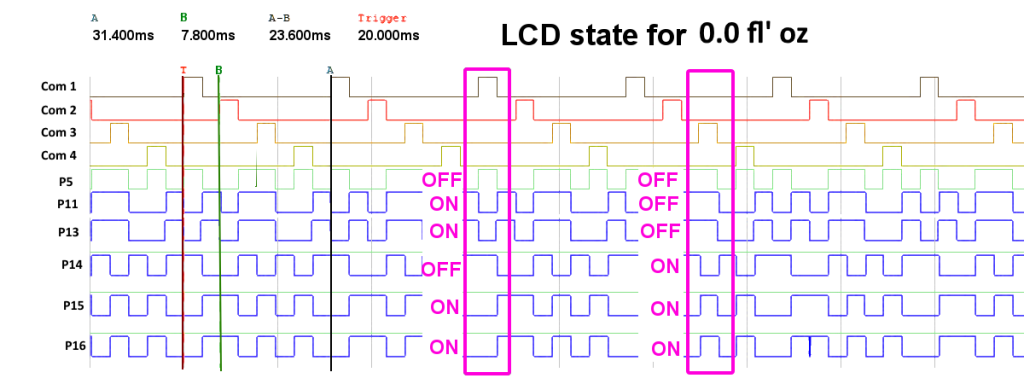
My scale has 16 pins, 4 of which are the common lines. Figuring out which ones are the common lines is pretty easy. They will likely be at one of the ends of the LCD and have a repeated pulse at the same interval, regardless of the scale state. I also found out that each common line has an active cycle of about 8ms with a 50% duty cycle. It is then inactive for the next 3 common line cycles for a total period of about 32ms. The following image shows the state of various pins with the LCD is displaying “0.0 fl-oz.” The annotations also demonstrate how to tell if a particular pin is on or off at any time.
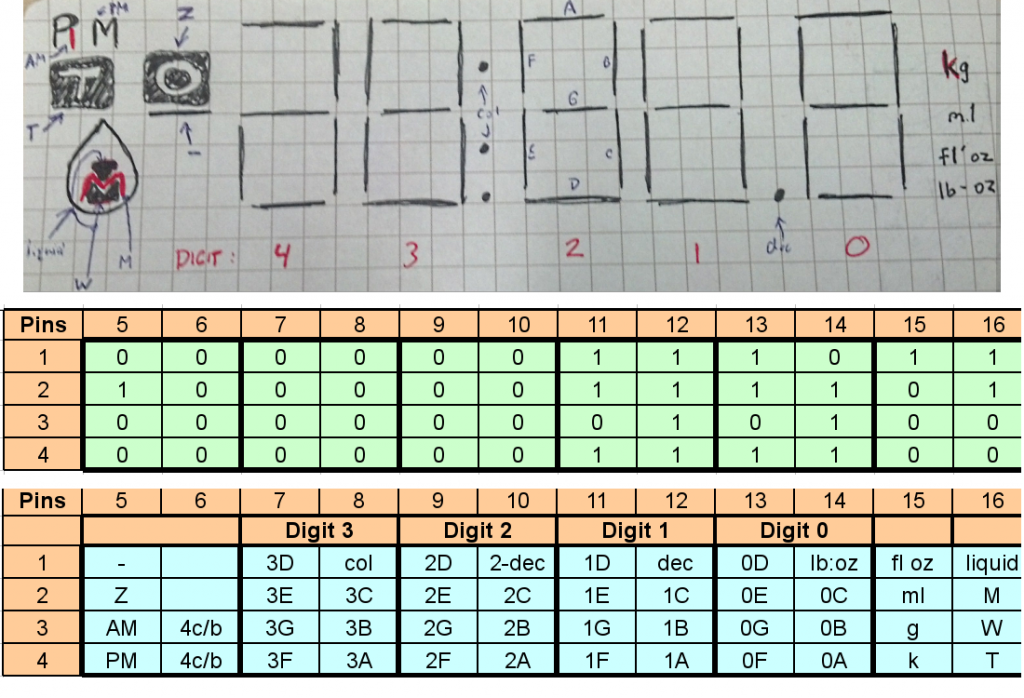
After enough readings have been taken, the control pattern will begin to emerge. For example, the following image shows every possible segment in the LCD, the full state of the pins for each common line when the scale reads “0.0 fl-oz,” and the complete mapping of the pins to an LCD segment.
A “1” in the table means a segment is on, so that pin is out of phase with the common line. Although only one data set is shown, it actually took about 5 readings with the same digit pattern (such as a ‘0’ at digits 0 and 1) before a pattern emerged and another 5 or 6 readings with different digit values before the map was completed.
Part 2: Circuit Design
In terms of physical components these are the parts I used to build the control circuit:
- Perfboard: Needed to house the soldered components.
- ATmega328p: The brains of the operation.
- ESP8266: Our connection to the Internet.
- Push Button: x1 (normally open, momentary).
- 10k Resistor: x5 (Color Code: Brown, Black, Orange).
- 4.7k Resistor: x2 (Color Code: Yellow, Purple, Red).
- 100k Resistor: x1 (Color Code: Brown, Black, Yellow).
- 22k Resistor: x1 (Color Code: Red, Red, Orange).
- 0.1uF Ceramic Capacitor: x3
- 10uF Aluminum Capacitor: x1
- 1uF Aluminum Capacitor: x1
- 8MHz Resonator: x1
- N Channel MOSFET: x1 (Logic Level), I’m using an NTD4960N
- 3.3V regulator: x1 Should output at least 500mA, but a higher cushion is desirable.
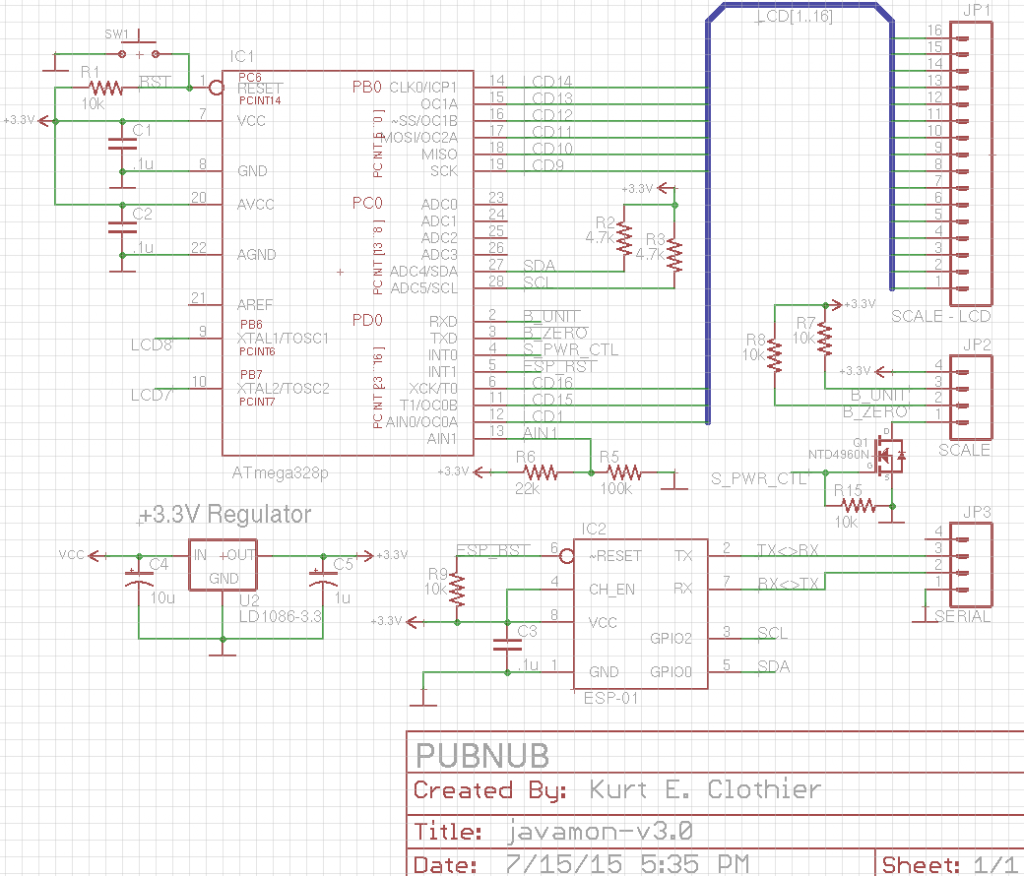
The mega328 has complete control over the scale. It directly drives the active low mode buttons, reads the LCD screen, and can even disable power to the scale using a transistor. This chip communicates with the ESP8266 via the I2C bus (also known as TWI).
The mega328 is also capable of resetting the ESP8266 if it requests such an event due to network issues or some other error state. The ESP8266 is responsible for publishing our scale data using PubNub. Take note, this entire circuit is operating at 3.3V DC.
You might have noticed from the schematic that we are only using one of the four common lines. The obvious reason is that we are out of I/O pins, but there is a more functional reason – the common lines are not a pure binary signal. I mentioned before that you use AC signals to drive the LCD pins, and this is more prevalent in the common lines where they are typically kept at half of the source voltage level during the inactive state. That makes it particularly difficult for them to be read on a digital input, and reading all four lines on analog inputs can lead to missed triggers due to the slow speed of the ADC clock.
To solve this issue, COM1 is fed into the chip’s analog comparator pin AIN0, with a trigger level of around 80% of the source voltage set on pin AIN1. This level is set using the basic voltage divider of R5 and R6.
The other three common lines are generated in code by a hardware timer. I found that an external resonator was not needed for more accurate clock timing, as the timing is synced with COM1 every cycle. Removing LCD lines that didn’t need to be read for our purposes also freed up a few ADC pins, so additional sensors could always be added!
The Firmware
The complete source code for all components is hosted on GitHub. To get your copy, clone or download the repository.
Part 1: Atmel ATmega328p
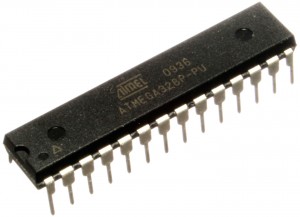 This chip has power over everything else in the circuit. The following actions take place on boot:
- Initialize I/O pins and hardware peripherals
- Enable the ESP8266
- Enable the scale, ensure in weight mode with grams as the unit
- Enable I2C bus
- Enter Main Loop
The main loop then does the following things about once per second:
- Read the LCD
- Decode the LCD data into a weight in grams
- Reset the ESP8266, if requested
- Keep the scale awake (every 45 seconds)
To keep the scale awake, the unit button is pressed a couple of times. Otherwise, the scale enters a clock display mode that cannot be easily exited. When enabled, a comparator event from COM1 will trigger in interrupt. The rest of the COM signals are simulated entirely using hardware timer 0, and the pin states at each COM cycle are stored and decoded. Although this chip is the main controller, it acts as a slave on the I2C bus. This was done primarily because the ESP8266 module in use does not have access to the actual I2C hardware pins, and a “bit-bang” master is much easier to implement than a slave.
When an I2C Read is initiated, the scale digits are transmitted on the bus. The first byte represents the upper two digits, while the second byte represents the lower two digits. For example, a weight of 1234 grams would be sent as [12] [34]. As the mega328 is never expecting an I2C write, such an event signals a reset request by the ESP8266. At this time, the mega328 will pull the reset line of the ESP8266 low for a few milliseconds and then release it. This is used as a rudimentary way to overcome error states in the ESP8266.
The source code for the ATmega328p can be found in the atmega328p directory of the project repository.
Part 2: ESP8266
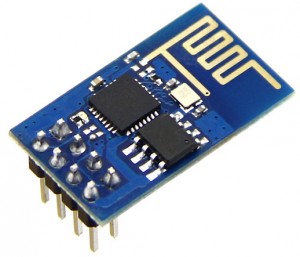 In this getting started guide for ESP8266, we walked through the basic PubNub library for the ESP8266. We are going to build upon the concepts in that post to create an actual IoT device! The same networking setup is used, so a lot of the code should look familiar. As usual, you must enter your own SSID and password in include/user_config.h to establish a WiFi connection! On boot, the following actions take place:
- Initialize UART and I/O pins
- Connect to WiFi network
- Connect to PubNub
- Enable a recurring 1 ms timer
The 1ms timer can serve as a main loop, as it is repeated every 1ms. It is here that we will request information about the scale or request a reset from the Atmel ATmega328p. The entire I2C bit-bang implementation is also handled here by using various state flags and setting the clock and data lines HI or LO accordingly. After both data bytes representing the scale digits have been read, the values are concatenated and used to build a JSON string to be published.
There is a minor change in the PubNub library from previous uses, but this is to be expected when designing firmware for specific purposes. This change affects the pubnub_connect() function, which now asks for a couple of callback function pointers as parameters.
This change is easily implemented by first creating a couple of callback functions. One is for the initial PubNub connection event, so this can be used to trigger other operations.
The second is for error states, such as when the PubNub connection is interrupted for whatever reason. This second callback also has a parameter which can be used to get information about what caused the error. The values associated with the error codes are listed in the Espressif SDK documentation. For this project, the error callback function is actually being used to request a reset from the ATmega328p.
The source code for the ESP8266 can be found in the esp8266 directory of the project repository.
The Build
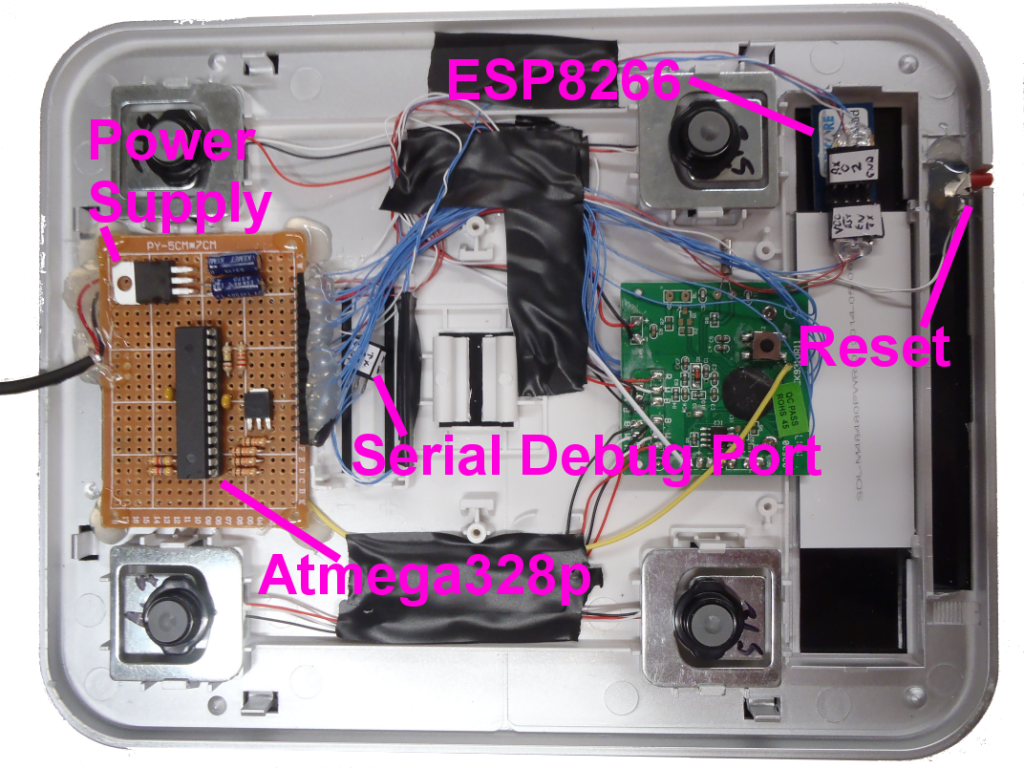
With the circuit designed, firmware loaded, and tests complete, it’s time to build the final product. The scale is pretty thin, but with some clever placement we can actually fit all of the new components into the original casing.
I elected to create a small circuit on a perfpoard, but a custom PCB could also be etched and populated.
Since this device will be stationary, I decided to get rid of that batteries and use an external power supply with internal regulation for all of the components. The line coming in supplies 5V DC from a USB cable which is plugged into a standard USB charger. There is just enough clearance to put the bottom case back on the scale.
If the bottom case is bulging at all, you might have to cut out areas of it where the additional components are sticking up so the weight of the scale itself is fully supported by the four load cells and not the case.
Realtime Web UI
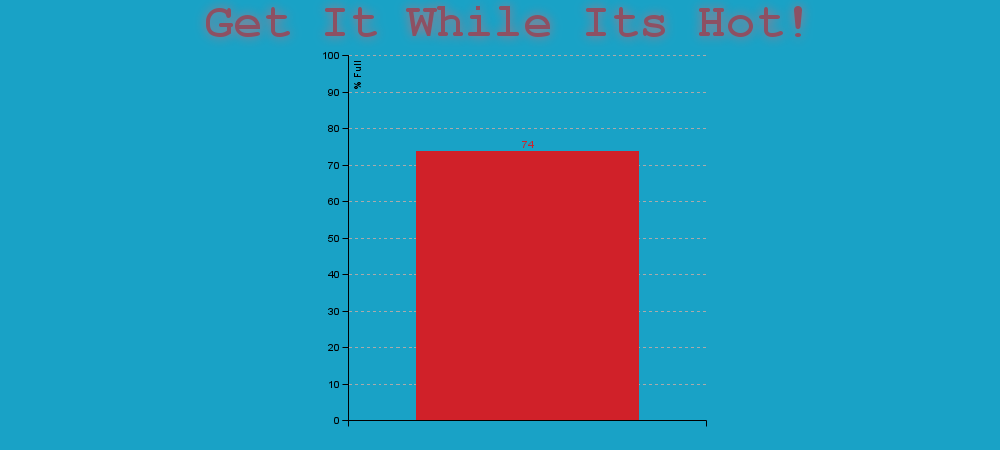
The data from our scale is streamed in realtime to our live-updating web UI. Our UI is very easy to use and uses EON, our JavaScript framework for IoT dashboards and maps for the data display. We first initialize PubNub and create an EON chart which is subscribed to the IoT coffee maker data channel.
To get your unique publish/subscribe keys, you’ll first need to sign up for a PubNub account. Once you sign up, you can get your unique PubNub keys in the PubNub Developer Dashboard. Our free Sandbox tier should give you all the bandwidth you need to build and test your app with the PubNub API.
The chart then updates with any new data published by the scale on the PubNub channel. The interface is also translating the raw scale weight into a percentage level from 0 to 100 by comparing the scale data with the known weight of the scale and a conversion factor. If a different coffee pot is used, the variable in the JavaScript can easily be updated with a new pot weight and conversion factor.
In addition, the interface will alert users if either the pot is off of the scale, or some unknown object is on the scale. This is done by comparing the scale weight with the known weight of the empty coffee pot.
The source code for the web interface can be found in the gh-pages branch of the project repository.
Wrapping Up
And there you have it – an IoT coffee maker level monitor powered by PubNub. If that seems a little too specific for you, then broaden your horizons… Replace the kitchen scale with a bathroom one, and track your weight loss, BMI, and whatever else your scale can do, in realtime!
You can even get rid of the scale altogether and use these concepts to collect data from anything with a segmented LCD screen. You are limited only by own imagination. With that said, I’d love to see what you come up with, so be sure to let us know about your awesome project!


