

IN THIS ARTICLE
This tutorial covers how to build realtime charts by streaming a data source to an interactive UI using the EON JavaScript Framework. In this general overview, we'll introduce you to four types of realtime charts (see below), and in future posts, we'll drill down deeper into each one. We'll use PubNub Data Streams to stream the data to our realtime chart.
Our four types of realtime charts we'll look at today:
A full open source GitHub repository for this project is available here.
Realtime Charts Quickstart
| Parameter | Value | Default |
|---|---|---|
| channel | Your PubNub channel name. | false |
| generate | Your C3 chart generation config. | undefined |
| flow | Used to update spline charts over time series. | false |
| limit | The size of your buffer. How many values to display on the chart before shifting the first value off and appending a new value. This is not native to C3. | 10 |
| history | Fill the buffer by using PubNub history call to retrieve last limit messages. Requires PubNub Storage & Playback to be enabled. | false |
| x_type | Your x axis configuration. Can be "auto", "custom", or false. We'll cover more on x_type below. | "auto" |
| x_id | Your x axis source if x_type == "custom" | "x" |
| message | A function to call every time a PubNub message is received. See PubNub Subscribe. | function(message, env, channel){} |
| transform | Method for changing the payload format of your stream. | function(m){return m} |
| connect | A function to call when PubNub makes a connection. See PubNub Subscribe. | function(){} |
| pubnub | An instance of the PUBNUB javascript global. This is required when using your own keys. See the subscribe_key example below. | false |
| debug | Log EON events to console as they happen. | false |
Simple Example
Plug your normal C3 config into the generate parameter. Supply a PubNub channel in channel parameter. eon.chart returns the normal c3 chart object.
That's it! Now you can publish messages to the same channel and they'll render in the graph.
All chart data must exist within an object called eon. Also notice how the channel matches in both examples.
This uses the included PubNub library to pubnub.publish() packets to the pubnub.subscribe() call waiting inside the C3 framework.
X-Axis Configuration
Automatic
eon-chart will automatically use the PubNub message timestamp for chart x values. This timestamp is recorded when a message is published to the PubNub Data Stream Network. This is the case when x_type is set to "auto".
Custom
If you'd like to supply your own timestamp (or other x value), set x_type to custom. Then, set x_id to the x value that appears within your published messages.
Notice how the code below publishes a key value pair called x with every message.
Disable
You can disable eon-chart modifications by setting x_type to false. By default C3 will use an incremental x axis (1,2,3,4...).
Distributed Systems
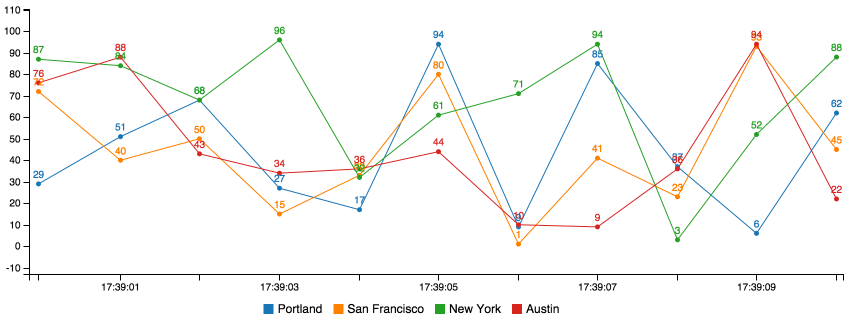
You can publish from multiple sources into one chart. For example, you can graph the individual memory usage from three servers by supplying the same channel to your PubNub publish requests. Check out our distributed chart example for more on this.
That’s all for this quick tutorial on building realtime charts with EON. For more in depth guide to EON, check out the video below, or read more on the EON project overview page.
Try PubNub today!


