Having the ability to stream data to a realtime, live-updating graph is pretty powerful. There’s no argument there. But until now, they’ve been fairly difficult to implement. Most of the time, you’d end up hacking a graphing library to re-render every time it gets new information.
 When I played with the C3.js demos on their homepage, I realized it was something different. Not only do the charts smoothly transition when new data points are added but you can even switch between chart types!
C3.js is a great way to graph realtime data. The transitions are smooth, the variety of chart types is awesome, and they look great. That’s why we’re happy to announce the new PubNub C3.js library; an easy way to update your graphs in realtime.
Getting Started with C3.js
It’s super easy to get started. The PubNub Chart library simply wraps C3 in a function that updates the graph when new messages are received.
Start by including pubnub.min.js, d3.v3.min.js, c3.js, and then finally eon-chart.js. You can get eon-chart.js from the github repo.
| <script src="http://cdn.pubnub.com/pubnub.min.js"></script> | |
| <script src="http://d3js.org/d3.v3.min.js" charset="utf-8"></script> | |
| <script src="../js/c3.js"></script> | |
| <script src="../js/pubnub-c3.js"></script> |
Then, just initialize eon-chart. The normal C3 config plugs into the generate param. For now, this spline chart will work just fine.
You also need to supply a PubNub channel in channel param. Choose a unique name for your graph.
| <div id="chart"></div> | |
| <script> | |
| var chart = pubnubC3({ | |
| channel: "c3-spline", | |
| generate: { | |
| bindto: '#chart', | |
| data: { | |
| x: 'x', | |
| columns: [], | |
| labels: true | |
| }, | |
| axis : { | |
| x : { | |
| type : 'timeseries', | |
| tick: { | |
| format: '%H:%M:%S' | |
| } | |
| } | |
| } | |
| } | |
| }); | |
| </script> |
Streaming and Publishing Data to the Graph
That’s it! Now you can publish messages to the same channel and they’ll render in the graph.
Make sure your messages are in the format that C3.js expects! For example:
| var pubnub = PUBNUB.init({ | |
| publish_key: 'demo', | |
| subscribe_key: 'demo' | |
| }); | |
| setInterval(function(){ | |
| pubnub.publish({ | |
| channel: 'c3-spline', | |
| message: { | |
| columns: [ | |
| ['x', new Date().getTime()], | |
| ['Austin', Math.floor(Math.random() * 99)], | |
| ['New York', Math.floor(Math.random() * 99)], | |
| ['San Francisco', Math.floor(Math.random() * 99)], | |
| ['Portland', Math.floor(Math.random() * 99)] | |
| ] | |
| } | |
| }); | |
| }, 1000); |
Notice how the subscribe_key and channel matches.
You can find a full C3.js realtime streaming example with code here.
More on Publishing Messages
This uses the included PubNub library to pubnub.publish() packets to the pubnub.subscribe() call waiting inside the C3 framework.
You probably want to publish data from the back-end instead. Check out our PubNub docs for more info.
Auto Populating the Graph
You may notice that when you refresh the graph is reset. Wouldn’t it be great to save the data so it could populate the graph automatically?
Just use the parameter history: true, and PubNub history will automatically fetch the last x messages for you and populate the graph with them!
Customize Your Graph
PubNub-C3 works will all supported graph types in C3. Just check out the examples below. You can learn more about customizing your graph from the official C3 docs.
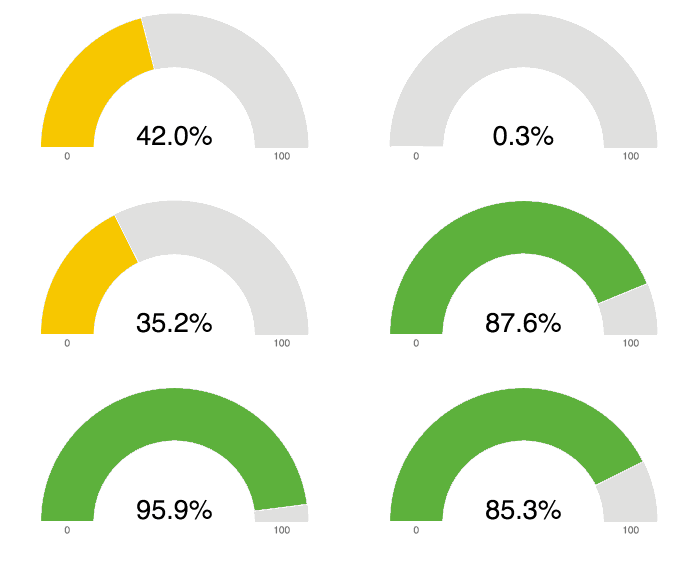
Gauge Chart
The gauge chart measures a specific metric between two predefined variables. Here’s a live, realtime gauge chart visualization example.

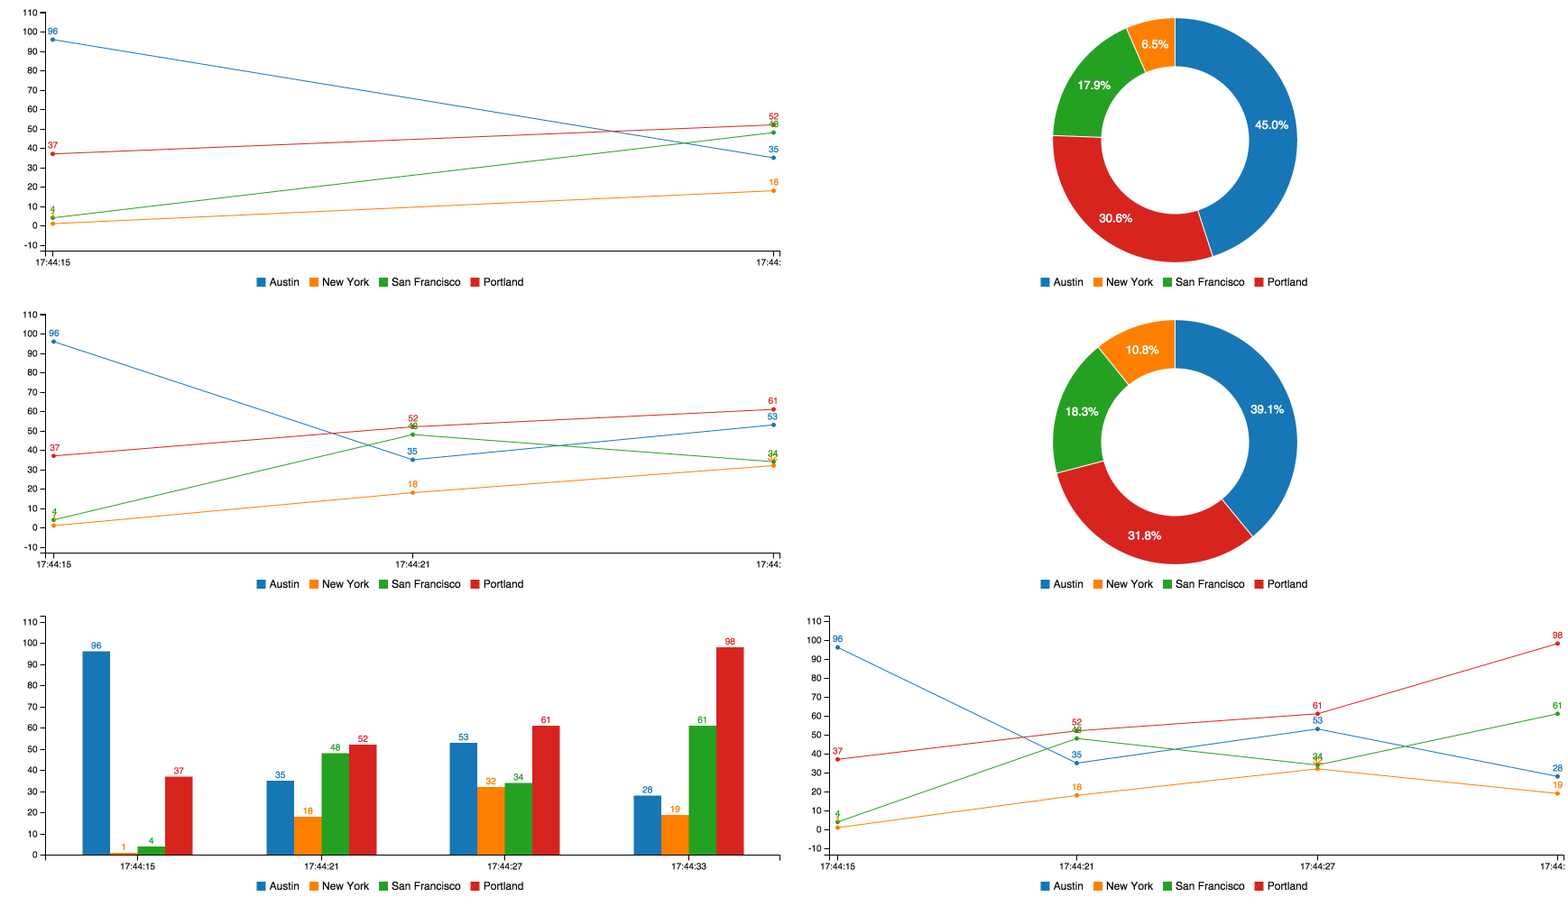
Donut Chart

A donut chart measures multiple variables and presents it in a circle visualization.
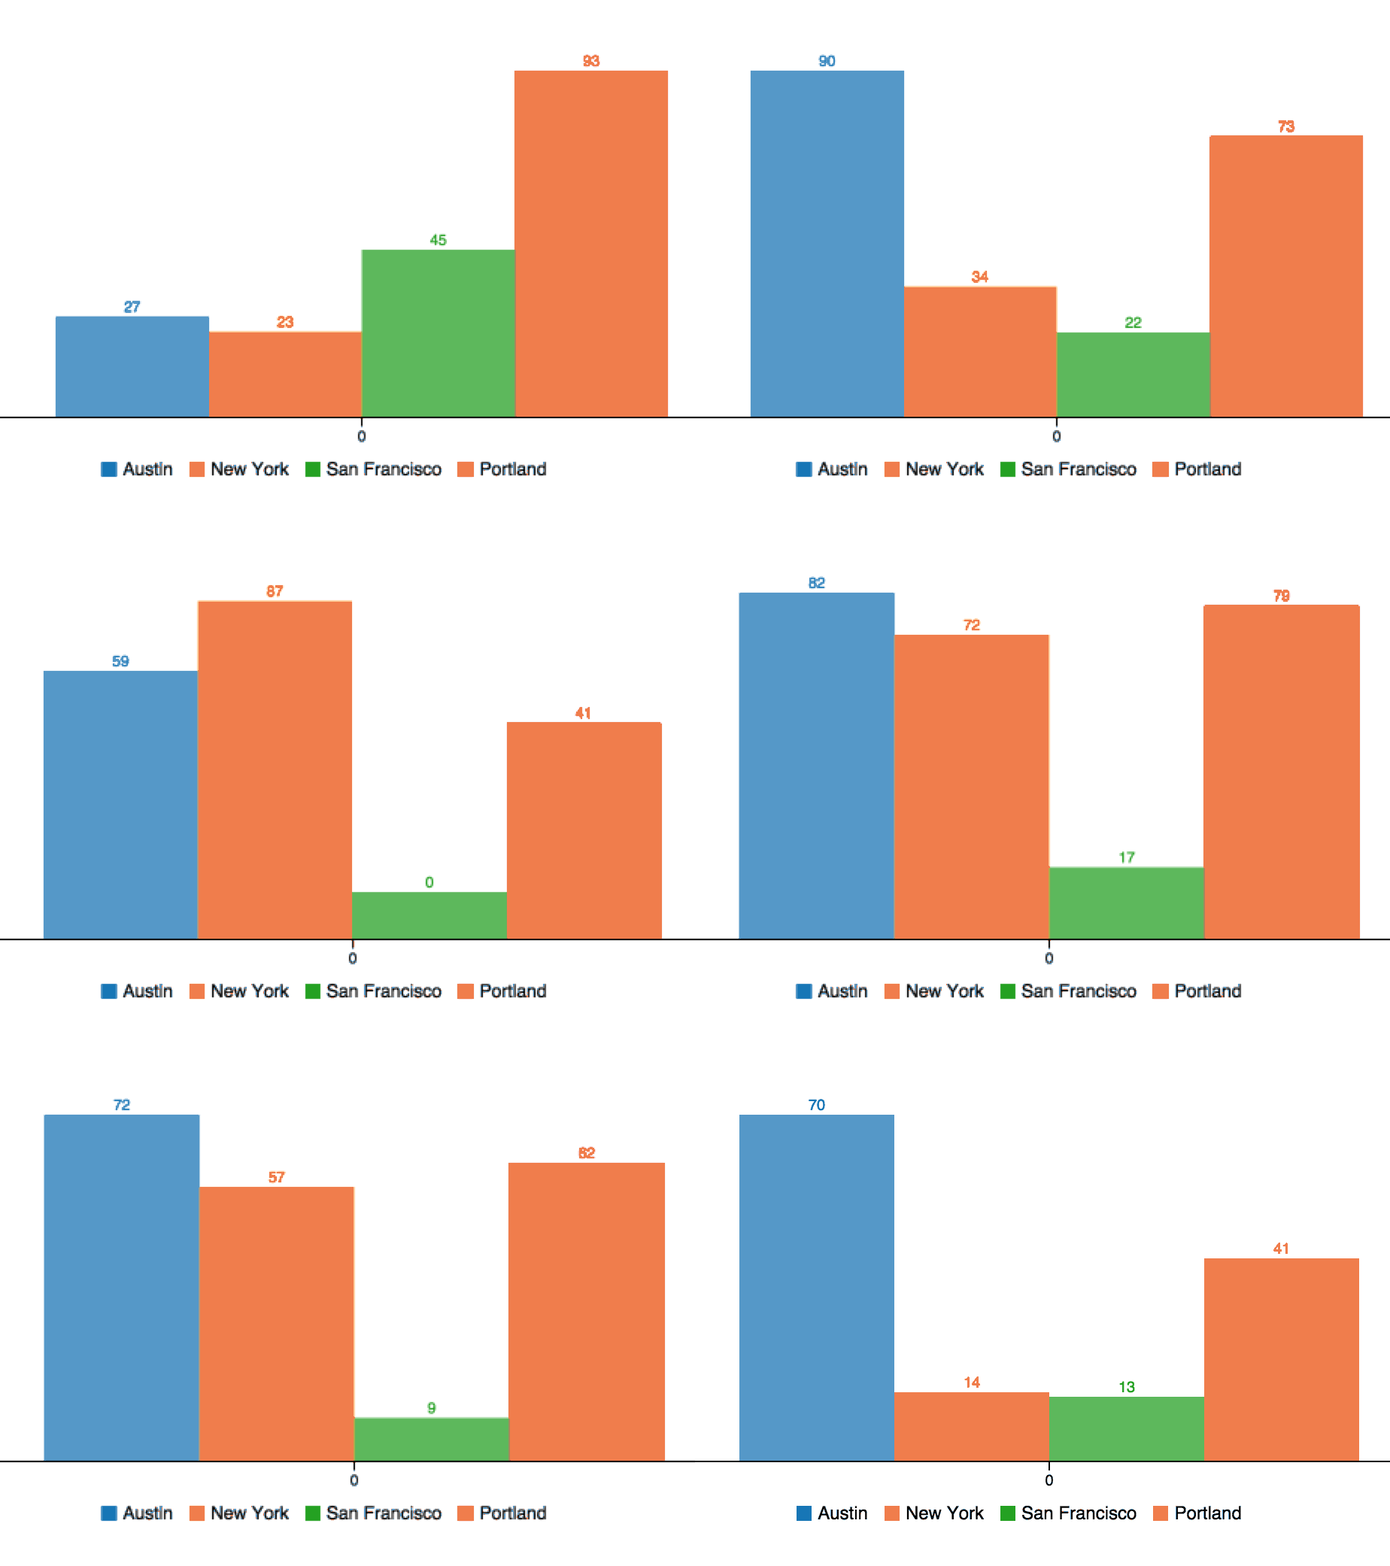
Bar Chart
Bar charts measures multiple metrics and presents them on bars of varying heights. Here’s a realtime, live-updating bar graph visualization example.

Transforming Chart

With transforming charts, the sky’s the limit. Get creative, mix types of visualizations, and present data in a cool and unique way.
Realtime Visualizations: Bringing Data to Life
Our C3.js library is just another way we want to bring data to life, by streaming then publishing it to a realtime, live-updating user interfaces. We have a ton of demos and tutorials around this already, including:
Check them out, stream data of your own, and look for more from us on realtime visualizations!


