IN THIS ARTICLE


    In our previous blog post, we showed you how to collect and publish realtime temperature and humidity data using the Tessel Climate module. Now it’s time to do something with that data.

    In this blog post, we’re going to use the Tessel Climate module, AngularJS, the NVD3 library, and PubNub to graph realtime temperature and humidity data over a WiFi network.

    We’ll get something that looks like this:

    0007_tessel_climate_visualize

    This tutorial picks up where we left off in our last post. If you haven’t yet, start with part one, where we show you how to set up your module and start publishing data. Then come back to this point.

    Displaying the Realtime Climate Data on a Graph

    In an HTML file, we’ll create the view for the data.

    First, we’ll have to include all of the special libraries to help us.

    <!-- Include the PubNub libraries -->
    <script src="https://cdn.pubnub.com/pubnub.min.js"></script>
    <script src="https://cdn.pubnub.com/pubnub-crypto.min.js"></script>
    <!-- Include Angular -->
    <script src="//ajax.googleapis.com/ajax/libs/angularjs/1.0.8/angular.min.js"></script>
    <!-- Include PubNub Angular -->
    <script src="http://pubnub.github.io/pubnub-angular/lib/pubnub-angular.js"></script>
    view raw 1.html hosted with ❤ by GitHub

    Include nvd3 CSS to style the graph:

    <link href="nv.d3.css" rel="stylesheet" type="text/css">
    view raw 2.html hosted with ❤ by GitHub

    Include the D3.js library:

    <script src="http://d3js.org/d3.v3.min.js" charset="utf-8"></script>
    view raw 3.html hosted with ❤ by GitHub

    Include nvd3:

    <script src="nv.d3.js"></script>
    view raw 4.html hosted with ❤ by GitHub

    Include the legend file from nvd3:

    <script src="legend.js"></script>
    view raw 5.html hosted with ❤ by GitHub

    Include the line file from nvd3:

    <script src="line.js"></script>
    view raw 6.html hosted with ❤ by GitHub

    Include the utils file from nvd3:

    <script src="utils.js"></script>
    view raw 7.html hosted with ❤ by GitHub

    Add scrolling to the body:

    <style>
    body {
    overflow-y:scroll;
    }
    </style>
    view raw 8.html hosted with ❤ by GitHub

    In the view, include the SVG we’ll be creating in the JavaScript.

    <svg id="graph"></svg>
    view raw 9.html hosted with ❤ by GitHub

    Declare the Angular app and controller.

    <div class="container" ng-app="PubNubAngularApp" ng-controller="ChatCtrl">
    view raw 10.html hosted with ❤ by GitHub

    We’re all set up, now let’s get to the interesting part!

    The Angular Magic

    We’ll build a controller with the PubNub Angular dependency so we can listen to the PubNub channels.

    <script>
    angular.module('PubNubAngularApp', ["pubnub.angular.service"])
    .controller('ChatCtrl', function($rootScope, $scope, $location, PubNub) {
    $scope.devices = {};
    view raw 11.js hosted with ❤ by GitHub

    We must subscribe to the same channel as our Tessel sensor is publishing. In this case, we’ve named it tesselclimate.

    $scope.channel = 'tesselclimate';
    view raw 12.js hosted with ❤ by GitHub

    Next, we initialize the PubNub service. You’ll need your publish/subscribe keys, available in the PubNub Admin Dashboard.

    if (!$rootScope.initialized) {
    // Initialize the PubNub service
    PubNub.init({
    subscribe_key: 'subscribe_key',
    publish_key: 'publish_key'
    });
    $rootScope.initialized = true;
    }
    view raw 13.js hosted with ❤ by GitHub

    The NVD3 will be expecting arrays of data that we can grab from the PubNub channel, so let’s set those up in preparation for receiving that data.

    var times_now = [];
    var temperatures = [];
    var humidities = [];
    view raw 14.js hosted with ❤ by GitHub

    Finally, our Angular app can subscribe to the tesselclimate channel and register for new message events — the messages are the most recent climate data as the sensor reads it! So neat!

    PubNub.ngSubscribe({ channel: $scope.channel });
    $rootScope.$on(PubNub.ngMsgEv($scope.channel), function(ngEvent, payload) {
    $scope.$apply(function() {
    if (payload.message.uuid) {
    view raw 15.js hosted with ❤ by GitHub

    Each message will contain the data at the time the sensor takes the reading, temperature, and humidity.

    $scope.devices[payload.message.uuid] = payload.message;
    $scope.time_now = Date.now();
    times_now.push($scope.time_now)
    $scope.temperature = payload.message.temperature[1];
    temperatures.push($scope.temperature)
    $scope.humidity = payload.message.humidity[1];
    humidities.push($scope.humidity)
    view raw 16.js hosted with ❤ by GitHub

    We need to draw the graph, so we use NVD3 to assist us. In this case, we’re going to draw a line graph.

    nv.addGraph({
    generate: function() {
    var width = nv.utils.windowSize().width - 40,
    height = nv.utils.windowSize().height - 40;
    var chart = nv.models.line()
    .width(width)
    .height(height)
    .margin({top: 20, right: 20, bottom: 20, left: 20})
    d3.select('#graph')
    .attr('width', width)
    .attr('height', height)
    .datum(climateData())
    .call(chart);
    return chart;
    },
    callback: function(graph) {
    window.onresize = function() {
    var width = nv.utils.windowSize().width - 40,
    height = nv.utils.windowSize().height - 40,
    margin = graph.margin();
    if (width < margin.left + margin.right + 20)
    width = margin.left + margin.right + 20;
    if (height < margin.top + margin.bottom + 20)
    height = margin.top + margin.bottom + 20;
    graph
    .width(width)
    .height(height);
    d3.select('#graph')
    .attr('width', width)
    .attr('height', height)
    .call(graph);
    };
    }
    });
    view raw 17.js hosted with ❤ by GitHub

    The addGraph function draws the graph with the data from the climateData function. For each data point taken, we gather the current time, temperature, and humidity. The x-coordinate for each temperature and humidity is the time when the corresponding climate reading is taken.

    The y-coordinate is the temperature or humidity reading. In this way, we’re graphing two lines (temperature, humidity) vs. time. Feel free to change the colors of the lines!

    function climateData() {
    var temp = [],
    humid = [];
    for (var i = 0; i < 500; i++) {
    temp.push({x: times_now[i], y: temperatures[i]});
    humid.push({x: times_now[i], y: humidities[i]});
    }
    return [
    {
    values: temp,
    key: "Temperature",
    color: "red"
    },
    {
    values: humid,
    key: "Humidity",
    color: "blue"
    }
    ];
    }
    // end nvd3
    }
    });
    });
    PubNub.ngHistory({
    channel: $scope.channel,
    count: 500
    });
    });
    view raw 18.js hosted with ❤ by GitHub

    With the Tessel already running, start a server locally and view the Angular file in your browser. Do you see a graph of temperature and humidity over time?

    Temperature and Humidity vs. Time:

    d3graph

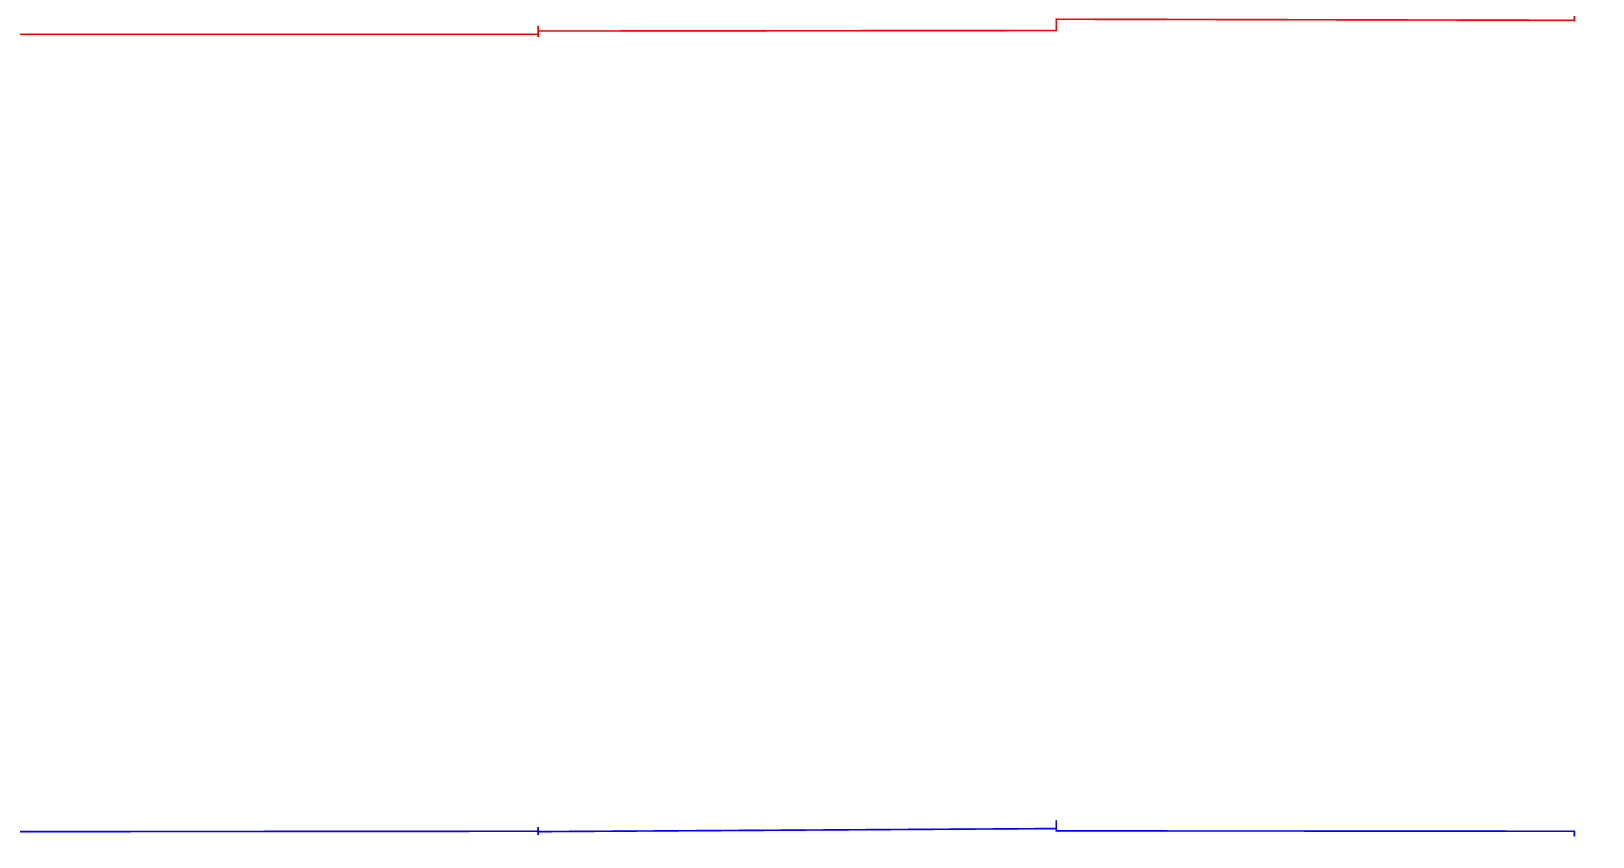
    Blue: Humidity, Red: Temperature

    As you can see, our readings stayed pretty consistent. Try covering and uncovering the sensor and watch the graph change! You could really do a lot with this data, how would you use it?

    Wrapping Up Tessel

    In this blog post, we had fun showing you a how to graph realtime Tessel Climate module data with PubNub. We hope you find this information to be useful — it is really cool to see the Internet of Things grow!

    Try PubNub today!

    Build realtime applications that perform reliably and securely, at global scale.
    Try Our APIs
    Try PubNub today!
    More From PubNub