

IN THIS ARTICLE
If 2018 had taught us anything, it’s no place on Earth is free of natural disaster. With the multiple California wildfires throughout the year, surrounding cities experienced heavy air pollution.
The World Health Organization estimates that 4.6 million people die each year from causes directly attributable to air pollution. With that in mind, even being aware of air particulates and toxins wage a difficult battle. Many people often don’t realize that their towns, let alone their own homes, could be filled with tainted air.
However, in this day and age of powerful IoT technologies, any person can combat bad air quality. Sensors and microcontrollers have gotten so cheap, so small, and so simple to implement, that practically anyone can install any type of monitor or sensor in their very own home.
In this tutorial, we’ll show you how easy it is to create an air quality sensor and monitor using a few low-cost electronics and PubNub Functions. The sensor will extract air quality information with multiple sensors, graph that data in realtime, and even set off a speaker alarm if the air quality reaches a harmful critical point.

What You’ll Need
- Arduino Uno
- Breadboard & Wires
- Basic Speaker
- MQ-2 Smoke Detecting Sensor
- MQ-7 Carbon Monoxide Co Gas Sensor
- Air Quality Sensor Hazardous Gas Detection Module
- DHT11 Temperature and Humidity Sensor
Hardware
Arduino Uno
Arduino Uno is one of the cheapest and most popular microcontrollers available today. Since the Uno has an onboard analog-to-digital converter, the analog signals produced from our sensors can be properly read. Other popular microcontrollers do not have this feature, so that’s why we chose the Uno for this project.
BreadBoard
A breadboard is a tool used to prototype and test circuits. Breadboards have two long rails (red rail for power and blue rail for ground) on each of its sides that are each connected vertically down the board. This is where engineers typically plug in a power supply and ground so that the whole rail can be easily used as a power and ground connection. At the center of the board, there are groups of 5-holed horizontal lines. Each of these lines is horizontally connected (5-hole connection) which are used for the circuit itself. You can even connect one grouping to another to make a 10-hole connection and so on and so forth.
Basic Speaker
You know what a speaker is. But here’s some fun cocktail party knowledge: a speaker is essentially a piece of vibrating metal that moves up by a magnet when fed power and falls down when unpowered. When the magnet is turned on and off at a specific frequency, a tone can be played. You won’t need to know much about how to code one of these, but it’s always nice to know!
Sensors
Each of the sensors we’re going to use operate on the same fundamental principle. A specific type of material is placed inside a sensor and an electric current is fed through it. When certain environmental conditions occur that react with the sensor’s specific material, the material’s resistance to the current increases or decreases. Thus the current will be affected and the sensor can then translate that change into proper sensor units.
Wiring
The wiring of each of these sensors follows the same pattern: connect ground pin of the sensor to the ground of the Arduino, connect the power pin of the sensor to the 5.5V pin of the Arduino, and connect the data pin of the sensor to a GPIO pin on the Arduino.
You can connect the sensors exactly as we did by following the diagrams exactly.

The Code
Our code will follow three parts: Arduino sketch, publishing code, and graphing HTML code.
- The Arduino sketch will handle the direct communication between the sensors and the Arduino.
- The publishing code will relay the data received by the Arduino to the PubNub SDK for publishing.
- The HTML code will then visualize the data into a graph in realtime on an HTML webpage.
Before you start, make sure you sign up for a free PubNub account. You’ll need your unique publish/subscribe keys to stream your data in realtime.
Feel free to reference this project’s GitHub repository for more information!
Arduino Sketch
For the Arduino code, we will be programming in the Arduino IDE in order to utilize its serial bus capabilities and simple method call structure.
First and foremost, we must import all of the necessary libraries for each of our sensors so that we can communicate with them in the Arduino IDE.
To do this, download the .zip file from each library’s GitHub and add them to your Sketch. Then include them like so.
GitHub links: DHT11, MQ135, MQ7, MQ2
#include <dht.h>
#include <MQ135.h>
#include <MQ7.h>
#include <MQ2.h>
Then you will need to create variables and instances for each of your sensors.
DHT11
#define DHT11_PIN 16	 //place this line below the include statements
//DHT
int chk;
dht DHT;
//MQ135
float M135;
MQ135 gasSensor = MQ135(A3);
//MQ2
int pin = A0;
MQ2 mq2(pin);
//MQ7
float ppm;
MQ7 mq7(A1, 5.0);
Next, you will need to create a setup function to initialize your Arduino’s baud rate as well as initiate any sensor’s necessary setup modules (in our case the MQ2).
void setup()
{
  Serial.begin(9600);
  mq2.begin();
}
To keep our program continuously running, create a loop method with a delay of 1 second.
void loop()
{
  //rest of the code
  delay(1000)
}
Inside the loop is where we will write the code to communicate with the sensor’s data. For each sensor, we essentially use the methods defined in their libraries to extract the data from the sensor and format the raw voltage reading to a recognizable unit of measure.
The code for each sensor is as follows:
MQ7 = analogRead(A1);
ppm = mq7.getPPM();
//Serial.print(" MQ7 = ");
//Serial.println(ppm,1);
//-----------------------------------
M135 = gasSensor.getPPM();
//Serial.print(" MQ135 = ");
//Serial.println(M135,1);
//-----------------------------------
//MQ2
float lpg = mq2.readLPG();
float smoke = mq2.readSmoke();
//Serial.print(" lpg = ");
//Serial.print(lpg,1);
//Serial.print(" Smoke = ");
//Serial.println(smoke,1);
//-----------------------------------
//DHT11
chk = DHT.read11(DHT11_PIN);
if(DHT.temperature > -500)  //don’t read any absurd readings
{
  //Serial.print("Temperature = ");
  Serial.println(DHT.temperature);
}
 if(DHT.humidity > -500)	   //don’t read any absurd readings
 {
  //Serial.print("Humidity = ");
  Serial.println(DHT.humidity);

 }
Note: We are going to comment out the serial.print lines except for the temperature and humidity. This makes future steps simpler. But if you’d like to test your devices, uncomment them. You can view the serial prints in the Arduino serial monitor. Just make sure that each sensor is publishing to a new line each time.
Lastly, we are going to program in our speaker. As discussed before, we must program the speaker to operate at a certain frequency to play a specific tone. We can easily do this by coding a pitches.h file.
Create a new file named pitches.h and paste the contents of this file in. At the top of your file, include the pitches.h file:
#include "pitches.h"
Next, copy and paste these methods that are responsible for playing a little jingle using the tone reference we created in the pitches.h file.
int melody[] = {NOTE_C4, NOTE_G3, NOTE_G3, NOTE_A3, NOTE_G3, 0, NOTE_B3, NOTE_C4};
// note durations: 4 = quarter note, 8 = eighth note, etc.:
int noteDurations[] = {4, 8, 8, 4, 4, 4, 4, 4};
void playTones()
{
// iterate over the notes of the melody:
for (int thisNote = 0; thisNote < 8; thisNote++)
{
  // to calculate the note duration, take one second divided by the note type.
  //e.g. quarter note = 1000 / 4, eighth note = 1000/8, etc.
  int noteDuration = 1000 / noteDurations[thisNote];
  tone(8, melody[thisNote], noteDuration);
}
}
Now we can have the jingle trigger if any of our sensor values reach above a certain threshold. You will need to create your own critical variables through trial and error as each sensor (at this price range) will come with a noticeable margin of error.
if((lg > lg_crit) || (smoke > smoke_crit) || (ppm > ppm_crit) || (DHT.temperature > temp_crit) || (DHT.humidity > hum_crit) || (M135 > M135_crit))
{
  playTones();
}
After you’re done writing the Arduino code, select your Arduino’s USB port, hit the green checkmark to compile, and the green right arrow to upload it to your connected Arduino.
Tip: You can find the name of the port your Arduino is connected to by going into the top menu: Tools->Port
The finished product should look like this:
Publishing Code
Now at this point, you may be wondering, why do we need separate code just to publish messages from our Arduino? Can’t we just do it straight from the sketch?
To simplify a complicated answer, the PubNub Arduino SDK requires the use of a WIFI shield to enable Internet capabilities. Since that is out of the scope of this project, we will revert to an alternative method: PySerial.
PySerial is a library that tunes in on the Arduino’s serial monitor. Anything printed over the serial monitor can be read by PySerial. Thus, we can extract the data from the serial bus and publish that data through PubNub.
To install Pyserial, type this command into your terminal:
pip install pyserial
Then create a python script and include these libraries (assuming you already created a PubNub account).
import serial
from pubnub.callbacks import SubscribeCallback
from pubnub.enums import PNStatusCategory
from pubnub.pnconfiguration import PNConfiguration
from pubnub.pubnub import PubNub
from time import sleep
pnconfig = PNConfiguration()
//Then set up your Pyserial port connection with the following line:
Arduino_Serial = serial.Serial('YOUR PORT NAME',9600, timeout=1)
//Now create a PubNub Instance
pnconfig.subscribe_key = "YOUR SUBSCRIBE KEY"
pnconfig.publish_key = "YOUR PUBLISH KEY"
pnconfig.ssl = False
pubnub = PubNub(pnconfig)
//Create a Publishing Callback
def publish_callback(envelope, status):
  pass
Next, create the infinite loop of your program that continuously extracts and publishes data. We must be careful now as PySerial’s serial bus monitor is very blind and can only see data coming in serially. It cannot distinguish names or variables, only numbers separated by the ‘
’.
Since we are only going to work with two different sensor readings (temperature and humidity), we can expect the 1st line of data being from sensor A, the second by Sensor B, the third by Sensor A, the fourth by Sensor B, etc.
Going back to the Arduino sketch covered earlier, our temperature sensor is printing first in the code, so we can expect that the pattern will go temperature, then humidity, then repeat. Thus we should capture the data like so, using the correct syntax from Pyserial.
#read in data from the serial bus 5(depends on the length of target data)
#characters at a time
#NOTE: you must decode the data as serial code is different from human code!
temp = str(Arduino_Serial.readline().decode('ascii'))
hum = str(Arduino_Serial.readline().decode('ascii'))
Next, we should print the values to the terminal before publishing using PubNub in order to see if we’re getting legit data:
print(temp+ '
')
print(hum + '
')
If everything is running smoothly, your terminal should look like this:
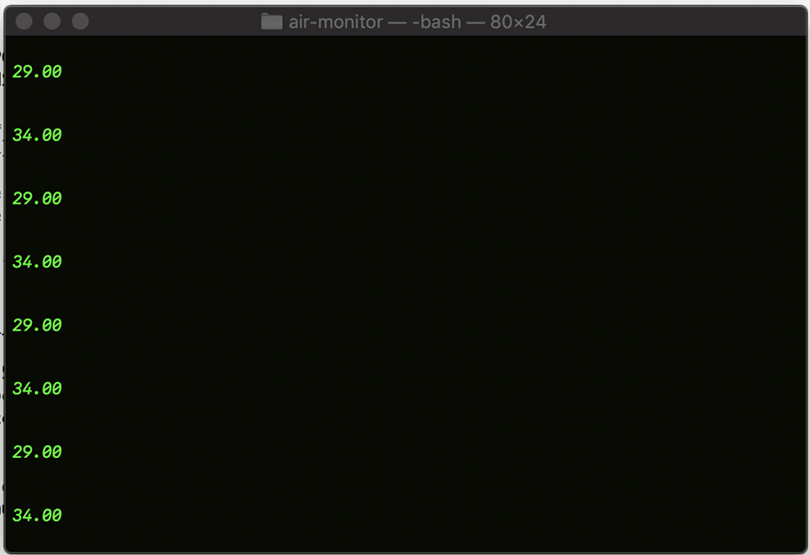
Notice: the alternation of data – 29 corresponds to temperature and 34 corresponds to humidity).
Now we’re going to publish this data to our realtime data visualization framework: PubNub EON. In order to send the data that EON can parse and graph, we must format the data first into a JSON format like so:
dictionary = {"eon": {"temp": temp, "hum": hum }} Then we can publish to the same channel that the chart will later be subscribed to and we’ll be good to go!
pubnub.publish().channel("eon-chart").message(dictionary).pn_async(publish_callback) HTML Graphical Representation Code
Now it’s time to use PubNub EON to display the readings in realtime on a live chart.
To add PubNub EON to any HTML page, simply add this div tag in your body, which will inject the actual chart:
<div id="chart"></div>
Then import the script tag SDK:
<script src="https://pubnub.github.io/eon/v/eon/1.0.0/eon.js"></script>
<link rel="stylesheet" href="https://pubnub.github.io/eon/v/eon/1.0.0/eon.css"/>
Then subscribe to the eon-chart channel that you will be posting data to:
eon.chart({
       channels: ['eon-chart'],
       history: true,
       flow: true,
       pubnub: pubnub,
       generate: {
         bindto: '#chart',
         data: {
           labels: false
         }
       }
     });
And that’s it! You’ve now got a connected device collecting and streaming air quality readings in realtime, and publishing them to a live dashboard, complete with threshold alerts! Your final result should look something like this:
Nice work! Want to explore other IoT use cases? Check out the tutorials below:
Try PubNub today!


