IN THIS ARTICLE
A couple months ago we released EON, a JavaScript open source framework for creating realtime dashboards and maps. Over the next couple weeks, we’ll dig deep into the framework and show you how to build different types of charts, graphs, and maps, making it easy for you to build your perfect realtime dashboard.
This blog post is an introduction to EON, where we’ll look at what’s inside the framework, how it works, how to get it, and the different types of charts, graphs, and maps you can build with it.
So let’s get started with realtime dashboards!
Click here for the full EON GitHub repository.

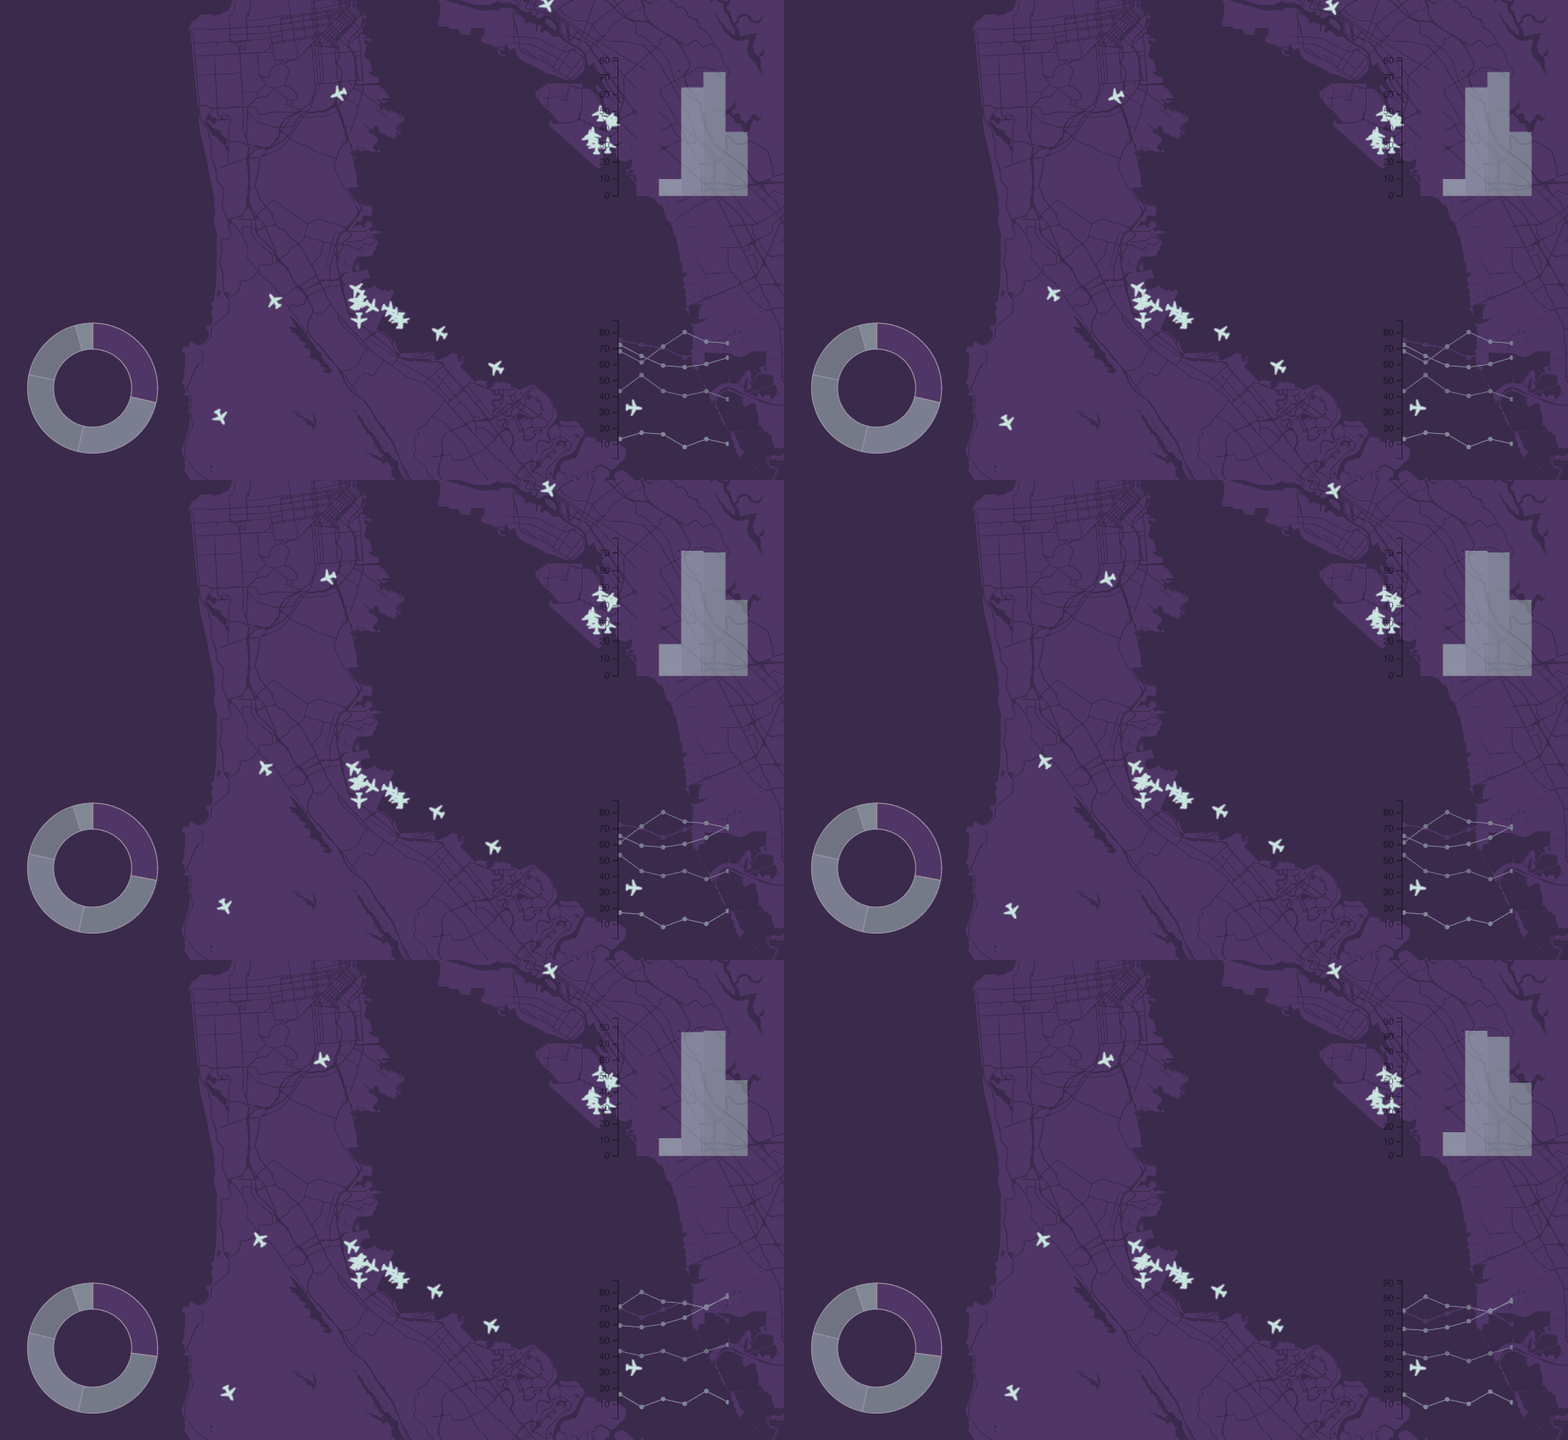
Real flight data in and out of San Francisco International.
EON
EON is an open-source chart and map framework for realtime data. The framework connects C3.js charts and Mapbox’s map widget to the PubNub Data Stream Network. Whether you’re building the next taxi app or an analytics dashboard, EON allows you to build realtime maps and charts that work on any platform.
Even better, it’s ready for the mobile web too. PubNub alone has SDKs for more than 70 platforms, so you can build in almost any environment.
What’s Inside EON
- C3.js (charts)
- Mapbox API (maps)
- PubNub (realtime)
C3.js is an awesome library based on D3.js that tweens animations between old and new data. So when you add a new data point to your chart, the transition is animated. This is great for streaming realtime data, because the animation brings attention to change, no refresh required.
Mapbox is a mapping SDK for custom maps. There are all sorts of tools, plugins, and styles, so it’s easy to create any kind of map you want. The most common use for hooking up a realtime stream to a map is to plot the location something. EON is focused on plotting markers on a map and animating their movement. Mapbox has support for custom markers, and we added animation in EON to tween old and new data.
PubNub is the realtime data stream network that handles the communication between EON and whatever platform your publishing data from. You publish from any of PubNub’s 70 supported platforms into EON using the same syntax.
How to get EON
EON is distributed as three libraries:
- eon-chart (C3.js + PubNub)
- eon-map (Mapbox + PubNub)
- eon (All of the above)
The easiest way to get started is to include the bundled JavaScript and CSS in your header like so:
Bower
In addition eon-chart and eon-map are distributed through bower, so you can:
We also host the individual packes on pubnub.com:
Realtime Charts Overview
C3.js is a great way to graph realtime data. The transitions are smooth, the variety of chart types is awesome, and they look great. C3.js powers eon.chart and the PubNub plugin makes them realtime.
You can include just the chart library like this:
And then define your chart:
Realtime Maps Overview
From custom designs, a Mac App, markers, data uploads and more, Mapbox has everything you need to make awesome dashboards. Mapbox powers eon.map and the PubNub plugin animates markers based on geolocations you publish
Include the scripts in your head.
And the define your map.
Publishing Messages
You use PubNub to publish messages to the same ‘channel’ supplied in the EON constructor. The data travels over the PubNub data stream network and gets rendered in the eon element.
Charts
This example comes from the eon-chart gauge example. Take a look at the rest of the eon examples.
You can PubNub publish from any of PubNub’s SDKs and as long as your data is in the same JSON format, everything will work just great.
Publish you data in the same format as C3.js expects. Each column is an array. The first column is the key and the second is the value:
Maps
This example comes from the eon-map simple example.
You can PubNub publish from any of PubNub’s SDKs. All you need to do is publish your lat and long values in an array.
The full code looks like this:
Creating Dashboards
You can embed multiple charts and maps on the same page, all displaying data from different channels. You can combine maps, charts, and other features into the same page.
Stay tuned for future tutorials on building realtime dashboards with EON!


