

IN THIS ARTICLE
 In our last blog post in our series on using data streaming functionality to create Rickshaw realtime charts, we gave an introduction of Rickshaw, d3.js, and PubNub, and built a basic realtime chart. We strongly recommend checking out that tutorial to learn more about realtime DIY visualizations.
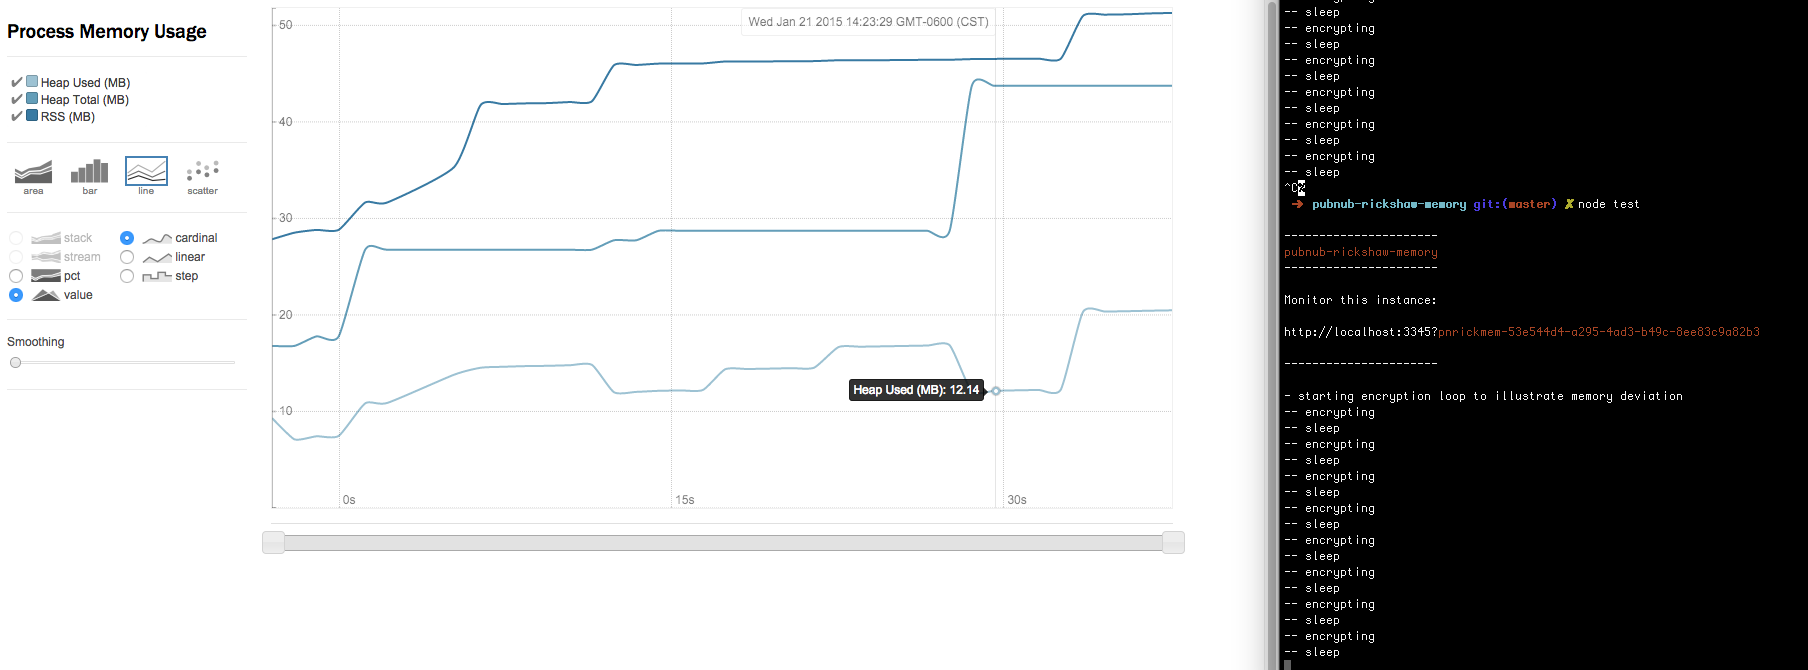
In this blog post (and the video below), we’re going to dig a little deeper and build another realtime chart. We’ll be monitoring Node.js memory usage using Rickshaw, d3.js, and a handy npm module.
The npm module plugs right into our Rickshaw-PubNub library, and contains everything you need to get started right away. It’ll automatically log your memory usage and spawns an express static server.
In the end, you’ll have a realtime chart that looks something like this:
How It Works
NodeJS memory usage is exposed through process.memoryUsage().
Every interval_timeout the module publishes the current output of process.memoryUsage() to the suppliedpublish_key and channel on the PubNub network.
Setup
There are a lot of moving parts, but a full working chart example is include out of the box.
First, install the module with npm.
Include in your app with {dev: true}. This will spawn an express server on localhost using the supplied port. This is a simple static server that already includes the contents of pubnub-rickshaw.
That’s it! Now when you run your node app, you should see the following:
Visit the url to see a realtime graph of your NodeJS memory profile over time. You can copy this javascript code, modify it, and embed it anywhere. Make sure to set your own channel!
Read more about pubnub-rickshaw-memory in the full documentation.
Try PubNub today!


