IN THIS ARTICLE
Subscribe to Our Newsletter
People tweet a lot. And lots of people tweet about things they feel passionately about. It’s easy to sift through a Twitter feed to look at how one person is feeling about a subject. But what about how everyone feels about a subject? That’s a little harder to do.
At PubNub, we sought out the best way to do this analysis at the scale of Twitter. In other words, we wanted to consume the Twitter firehose, filter tweets by subject, analyze the sentiment (emotion), and visualize it on a realtime dashboard.
That’s exactly what we did with our Sentiment Analysis Machine. And the first thing we want to measure is the 2018 Midterms.
To test our machine, we chose to analyze the most polarizing upcoming event we could think of – the 2018 Midterms. The machine tracks dozens of keywords like Midterms, #election, redwave, bluewave, Cruz, Beto, and gauges each Tweet on a scale of 😠to 😁.
How Does It Work?
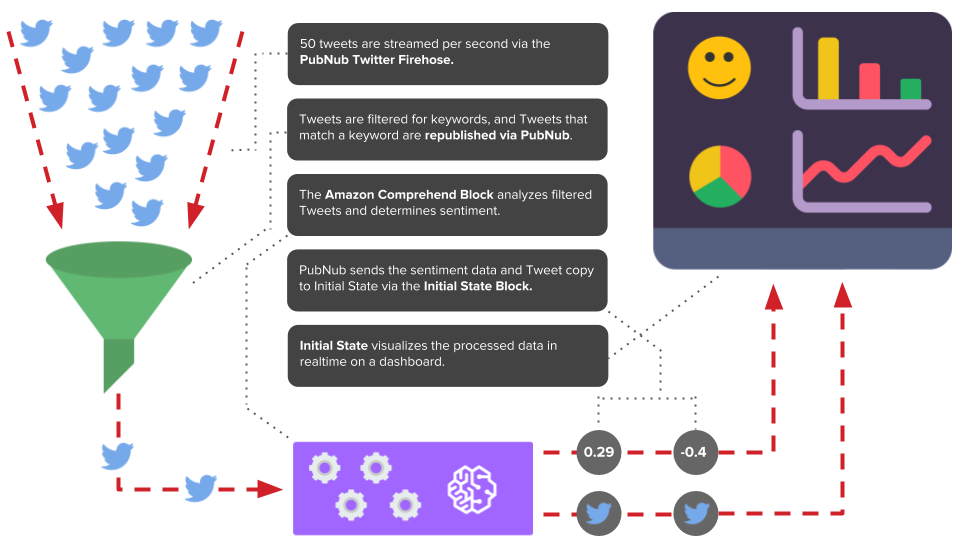
The application itself is truly realtime, and all processing and analysis, from firehose to dashboard, takes under a second. All messaging runs through PubNub.
- The PubNub Twitter Firehose pipes in 50 Tweets per second, which are filtered by keywords.
- Tweets that match one of our selected keywords are processed through the Amazon Comprehend Block, which serverlessly gauges the sentiment of the Tweet.
- Results are sent in realtime to the live-visualization dashboard, powered by Initial State.
Want to check out the code? The full GitHub repo is available here.
Building a HIPAA-compliant App