IN THIS ARTICLE
Subscribe to Our Newsletter
With PubNub Realtime Analytics, you have always been able to view an up-to-the-millisecond breakdown of publish/subscribe messages for your PubNub applications.
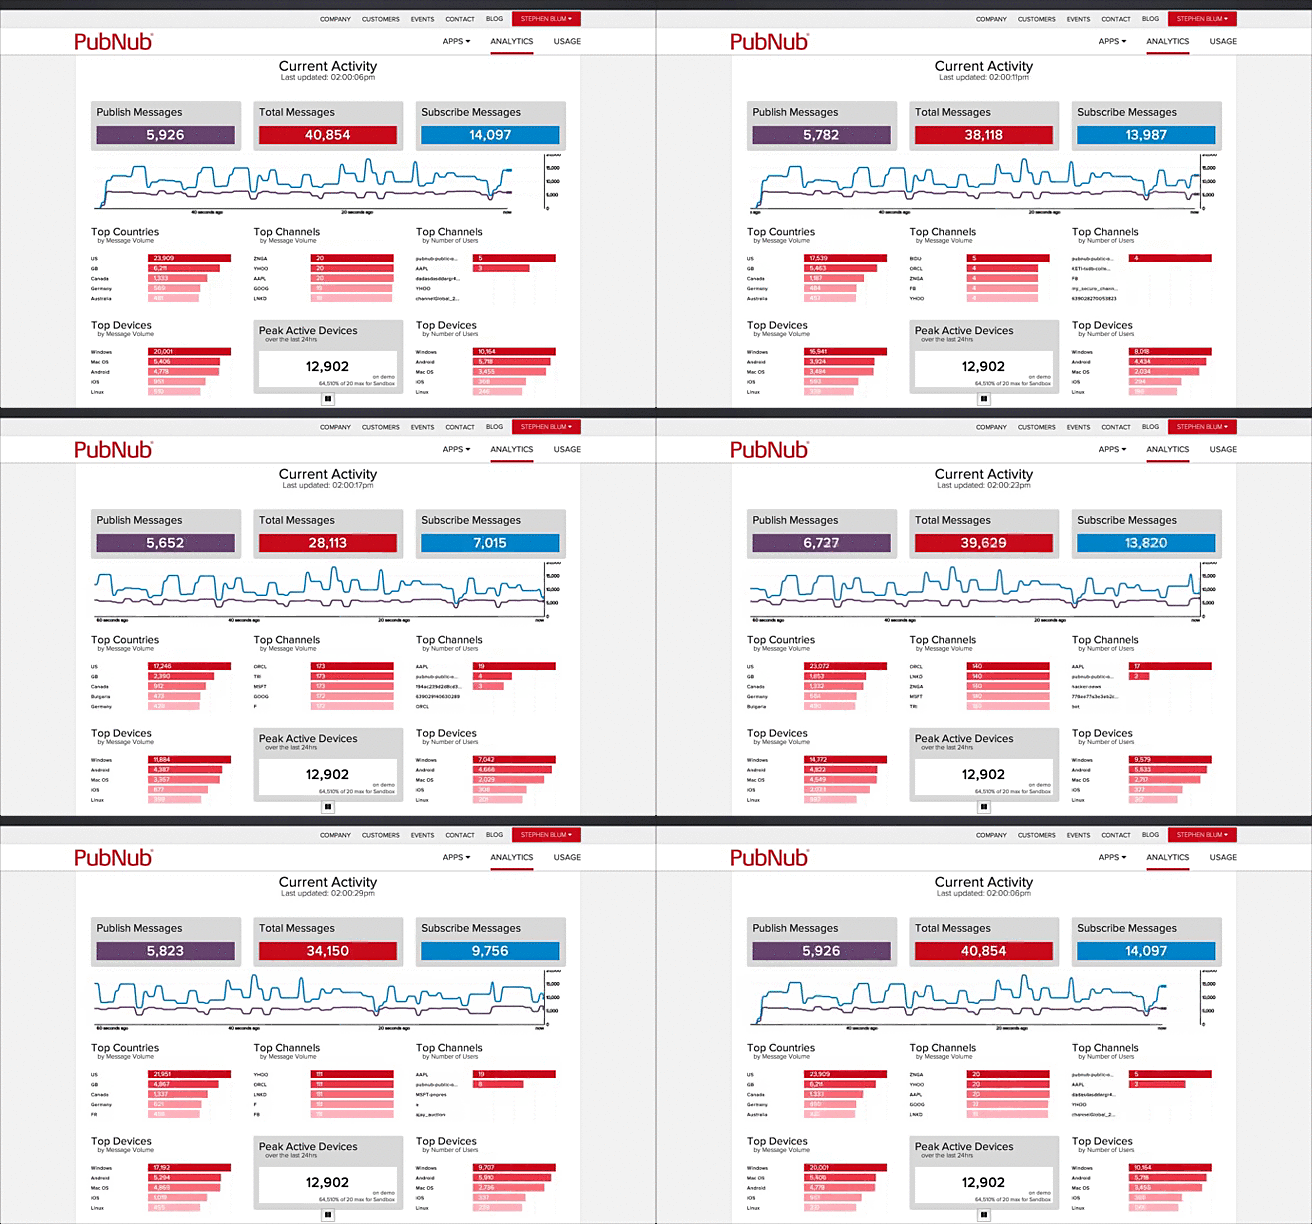
Now, our new Realtime Analytics dashboard streams live-updating metrics including:
- A live world map that charts your realtime data based on geolocation
- Top countries by message volume
- Top channels by message volume and number of users
- Top devices by message volume and number of users
- Peak active devices

Why PubNub Realtime Analytics?
Realtime visualizations show the value, impact and scalability of PubNub in your application, giving you key metrics at your finger tips. It’s never been simpler to understand your realtime traffic and user base.
Availability and Access
The new Realtime Analytics dashboard is available today in the PubNub developer portal.
For current Realtime Analytics customers, no integration work is required. Click on the Analytics tab and you are up-and-running. Others can simply add the Realtime Analytics feature by clicking the Add button on the PubNub portal landing page.


