IN THIS ARTICLE
Tracking financial data is just one of the many sets of data we can collect, stream, and visualize. In this blog post, we’re going to take profit earned by drivers, then chart that data on a realtime, NVD3 visualization with AngularJS.
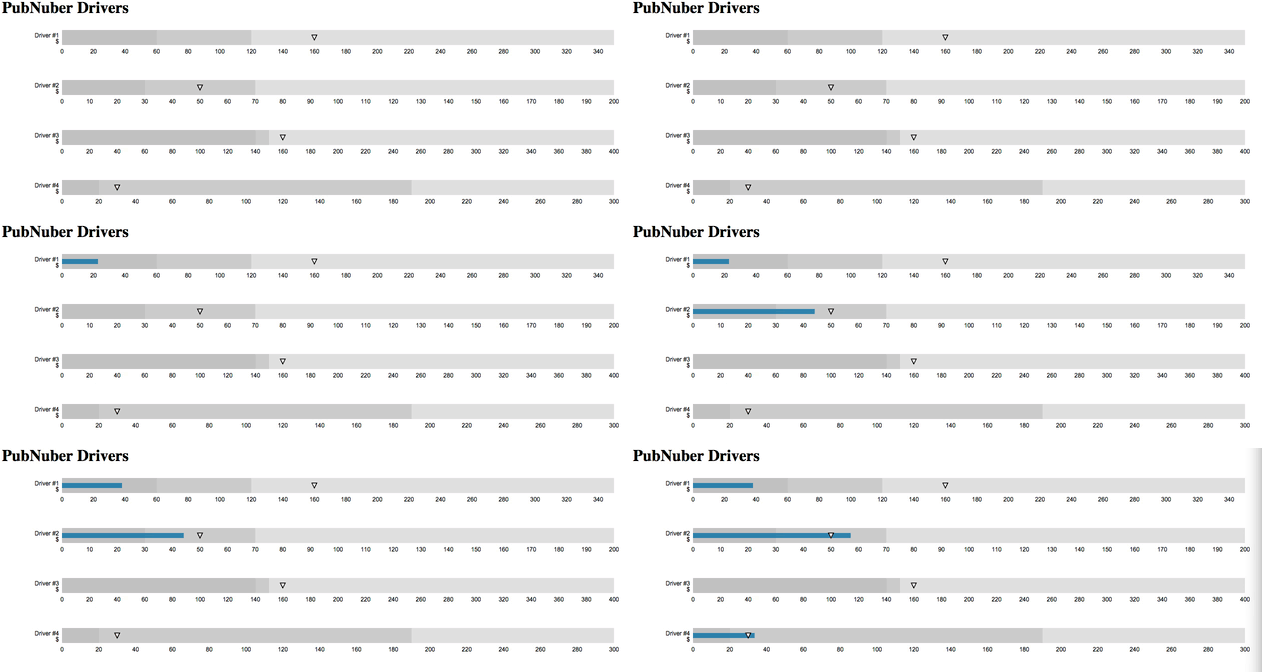
Take this PubNub application for example.
Over time, the bullet charts fill-in when each driver completes a route. The shaded areas can represent the minimum amount a driver has ever made, the average amount, and the maximum amount over a period of one-day. The pointer on the graph can represent a milestone.In this case it means the minimum amount necessary to meet the costs of the driver.
Setup
The setup for the index.haml is short. HAML is a pre-compiled version of HTML. It can be easier to read and write. First take a look at the dependencies:
- d3 allows you to draw graphs.
- NVD3 makes those graphs pretty.
- angular is used for it’s powerful views and controllers.
- pubnub.min.js supports pubnub-angular.
- pubnub-angular.js is used for real-time communication for Angular.
- nv.d3.min.css provides styles for the graph.
Note that pubnub-angular.js is in the directory. You can get this file by using Bower and typing bower install pubnub-angular. This will put the file in a bower_components package. Just take the file out of there. Next set-up the Angular app.
This takes care of the basics for HTML/HAML. Next you need to set-up the JavaScript.
Make sure to include the driver.js file into the html.
The JavaScript
In the first line you declare the Angular app.
Then without a semi-colon, use dot notation to instantiate the controller.
In this example the array syntax for injecting services was used. This style is useful for production minification. This is a lot. You should run the app thus far to make sure there are no errors.
Basic Data
Set up a basic structure for the drivers. In this case there are 4 drivers. The requirements are shown here in the JSON. Put these objects side-by-side in an array.
More JS
Cutting back to the JavaScropt, use the $http service to pull in the static JSON data.
Notice that it passes the data to the main() method. As with other asynchronous calls, you need to use some sort of callback. That’s what main() is for. Name the data as $scope.drivers. And pass those drivers onto a graph.
NVD3
In the graphs function use the forEach method on the JSON array.
In this function you declare a bulletChart, the style of chart for this app. D3 selects the id of the appropriate SVG, more on that later. D3 takes an object for its configuration, in this case you use the processChart() method. The transition describes animations for the chart.
ng-repeat
Note that you declared $scope.drivers earlier. This means you can use this data with Angular. Back in index.haml….
This is the magic of Angular. It allows you to repeat the number of objects in the array. With each object you give an svg the ID of “chart<driver’s id number>”. For example “chart 1” for the first driver. This allows you to show 4 charts with two lines of code.
Listening with PubNub
Now set the graphs to listen for messages. Earlier you injected the PubNub service in the controller. Now you will use it.pubNubInit() is called from the main method.
To get your unique pub/sub keys, you’ll first need to sign up for a PubNub account. Once you sign up, you can get your unique PubNub keys in the PubNub Developer Dashboard. Our free Sandbox tier should give you all the bandwidth you need to build and test your messaging app with the web messaging API.
Subscribe to the channel.
Then use $rootScope to be able to manually drive the rest of the app on a message event.
With each message get the driver position and tally-up the fare they just acquired.
With that information, add it to that driver’s chart.
Now that you’re listening with PubNub, it’s time to send some messages!
Sending with PubNub
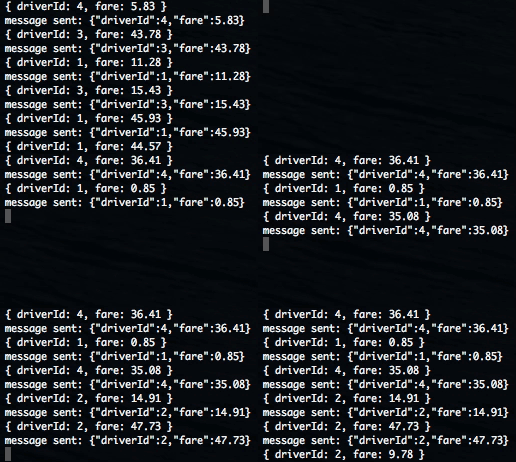
In the code example there is a file spoof.js. This spoofs various messages in under 40 lines of JavaScript. PubNub is that easy! You can simply use this file and change the various numbers and parameters for different results. In order to use the file, you need to have Node and NPM installed.
Go here if you need to install these and follow the tutorial. With node use npm install pubnub. Then type node spoof.js. That’s it! You’ll see your messages start sending.
Help Running the Graph
Now that you’re sending messages you want the graph to be able to populate based on the data. Use python -m SimpleHTTPServer or simple open the index.html in your web-browser. You should see the graph populate as you send messages!


