IN THIS ARTICLE
Subscribe to Our Newsletter
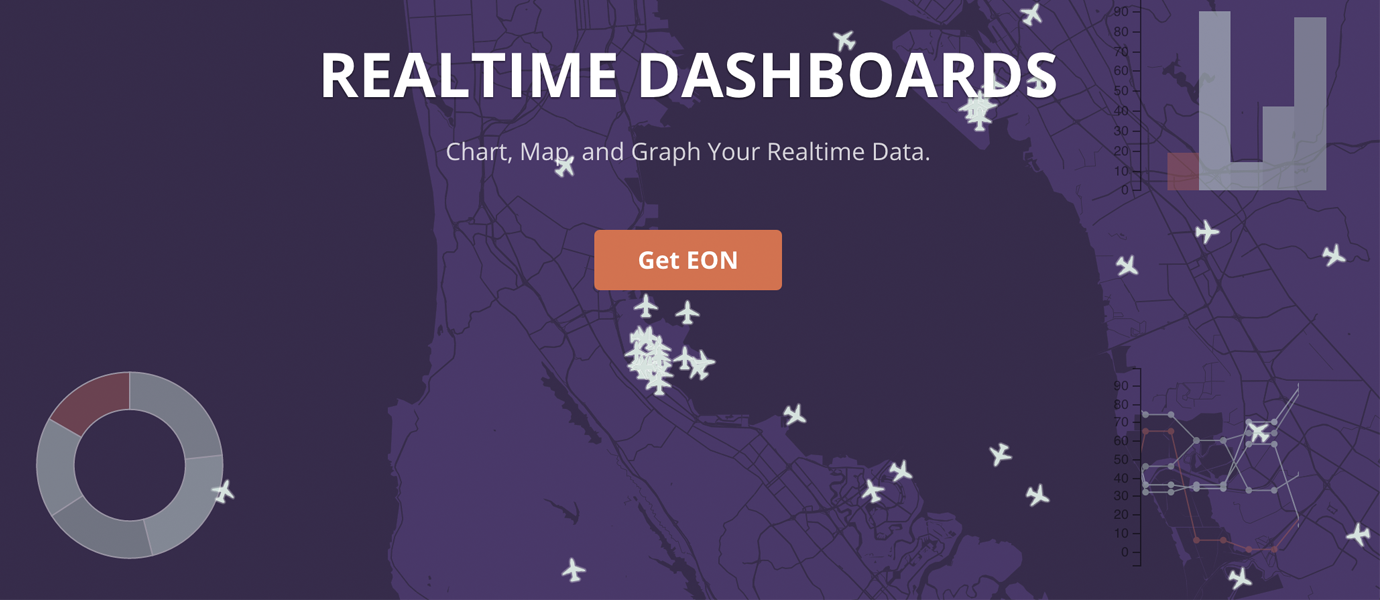
Today we’re pleased to announce the release of Project EON, our brand new JavaScript open source framework for building beautiful realtime dashboards, charts, and maps.
Sounds like D3.js?
Yes, but so much more. EON connects C3 charts and utilizes Mapbox’s map widget to realtime streams of data, meaning you can collect, detect, and publish data in realtime to live-updating charts, maps, graphs, and more. And it’s easier than ever.
When Should I Use EON?
Anytime you want to stream data and visualize it. This could be a dashboard monitoring sensor readings from thousand of sensors in the field. This could be vehicle location and state on a live-updating map. This could be financial data in a stock trading application.
Any use case where you need to collect and consume, then visualize data is fair game.
Charts and Graphs
The charting and graphing component of EON is based on C3.js, an open source charting library. This enables you to build realtime line, bar, pie, gauge, and donut charts. When new data is streamed, transitions are animated and changes are reflected in realtime.
No manual refreshing required!
Even better, with history, data can be stored and retrieved opening up the possibilities for persistent time series charts (or even analytics).
Maps
The mapping and geolocation component of EON is based on Mapbox, a series of APIs and tools for building custom maps. Give EON a marker icon (bus, train, plane, person), and a geolocation. When the geolocation is updated, the market animates and travels to the new location.
Ideal for Distributed Systems
Graphing data from a single source to a single chart is cool, but what about multiple devices to a single chart, or even a single device to multiple charts? EON supports it all.
Take an IoT use case for example. With EON, you can have all your different connected devices publishing to a single dashboard simultaneously.
Cross Platform Ready
EON can publish data from any of PubNub’s 70 SDKs. Whether it’s JavaScript, Python, C, Arduino, Raspberry Pi or Atmel, it all works. The framework can render charts and maps on any HTML and JavaScript platform, including mobile apps (using PhoneGap).
Getting Started
Head over to the Project EON homepage or check out the Project EON GitHub repository. We have a ton of tutorials and getting started with EON guides for specific charts, as well as maps.


