

IN THIS ARTICLE
Subscribe to Our Newsletter
It’s important to keep tabs on your running PubNub Functions, monitoring their state and health. PubNub provides structural integrity for applications of any scale, but there could be times where the code within the Function does something you didn’t intend, so we’ve developed a tool that allows you to monitor those irregularities.
The Function monitoring tool is a Python script that monitors all of your event handlers and displays alerts/notifications in the terminal. This is beneficial because you can easily add all of your logs of this system to Elasticsearch via the remote server running the monitor. This will enable services like Kibana, Grafana, and PagerDuty – which in turn covers logging, metrics, and alerts for the on-call engineering team.
NOTE: If you used SSO (Google) to sign in, you will need to go into the admin portal and change your password. The new password you set will be the one you enter into the tool down below.
Set Up and Running the Tool
First, we’ll start off by cloning the project.
git pull https://github.com/bigoper/pubnub-monitoring-functions.git master
Once we have that, go into the pfunc-monitor folder.
cd pfunc-monitor
Now install all the dependencies.
sudo pip install -r requirements.txt
Great! Now let’s add our credentials for PubNub.
python app.py --user=YourEmailAddress --password='yourPassword'
If your login is correct, the terminal should print out Success.(1). Once you receive that, you can run the script and let it listen for any notifications that come in from your Functions.
python app.py
Now if anything comes up, you’ll see it in your terminal!
How does it work?
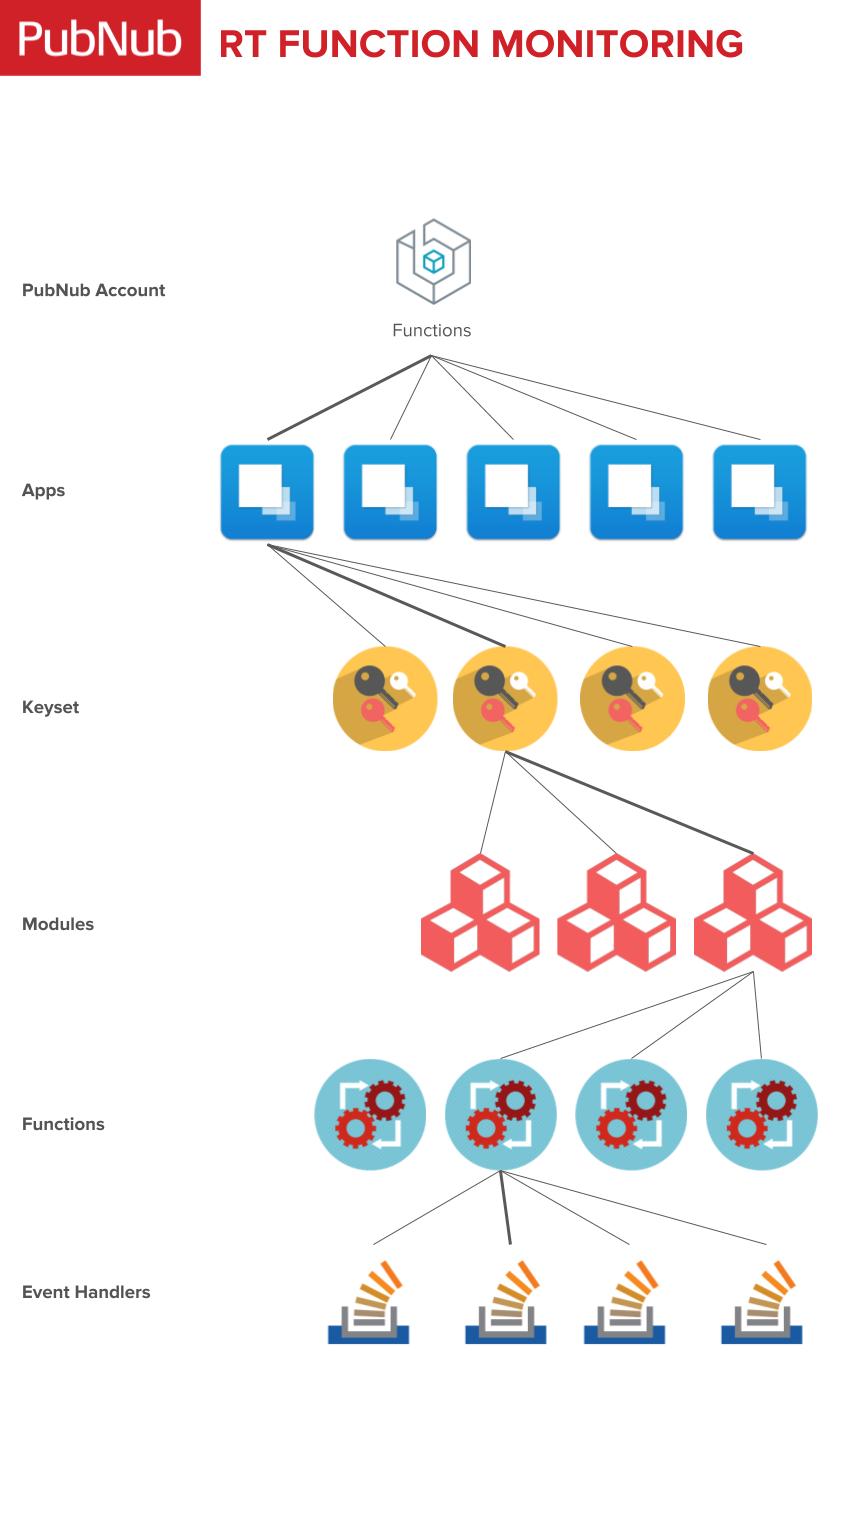
It’s important to understand the different layers of a PubNub Function, which in turn gives us a better understanding of the different channels it makes on startup.
Looking at the diagram below, you can see the different apps we’ve created in our PubNub account. Inside those apps, we have keysets that are linked to those apps. Each keyset then has their own modules, and finally, within those modules, we have our Functions.
This is really important for understanding our code, since from a debugging perspective, we are subscribing to channels related to each piece in the hierarchy.
Let’s see how this would look in our Admin Dashboard.
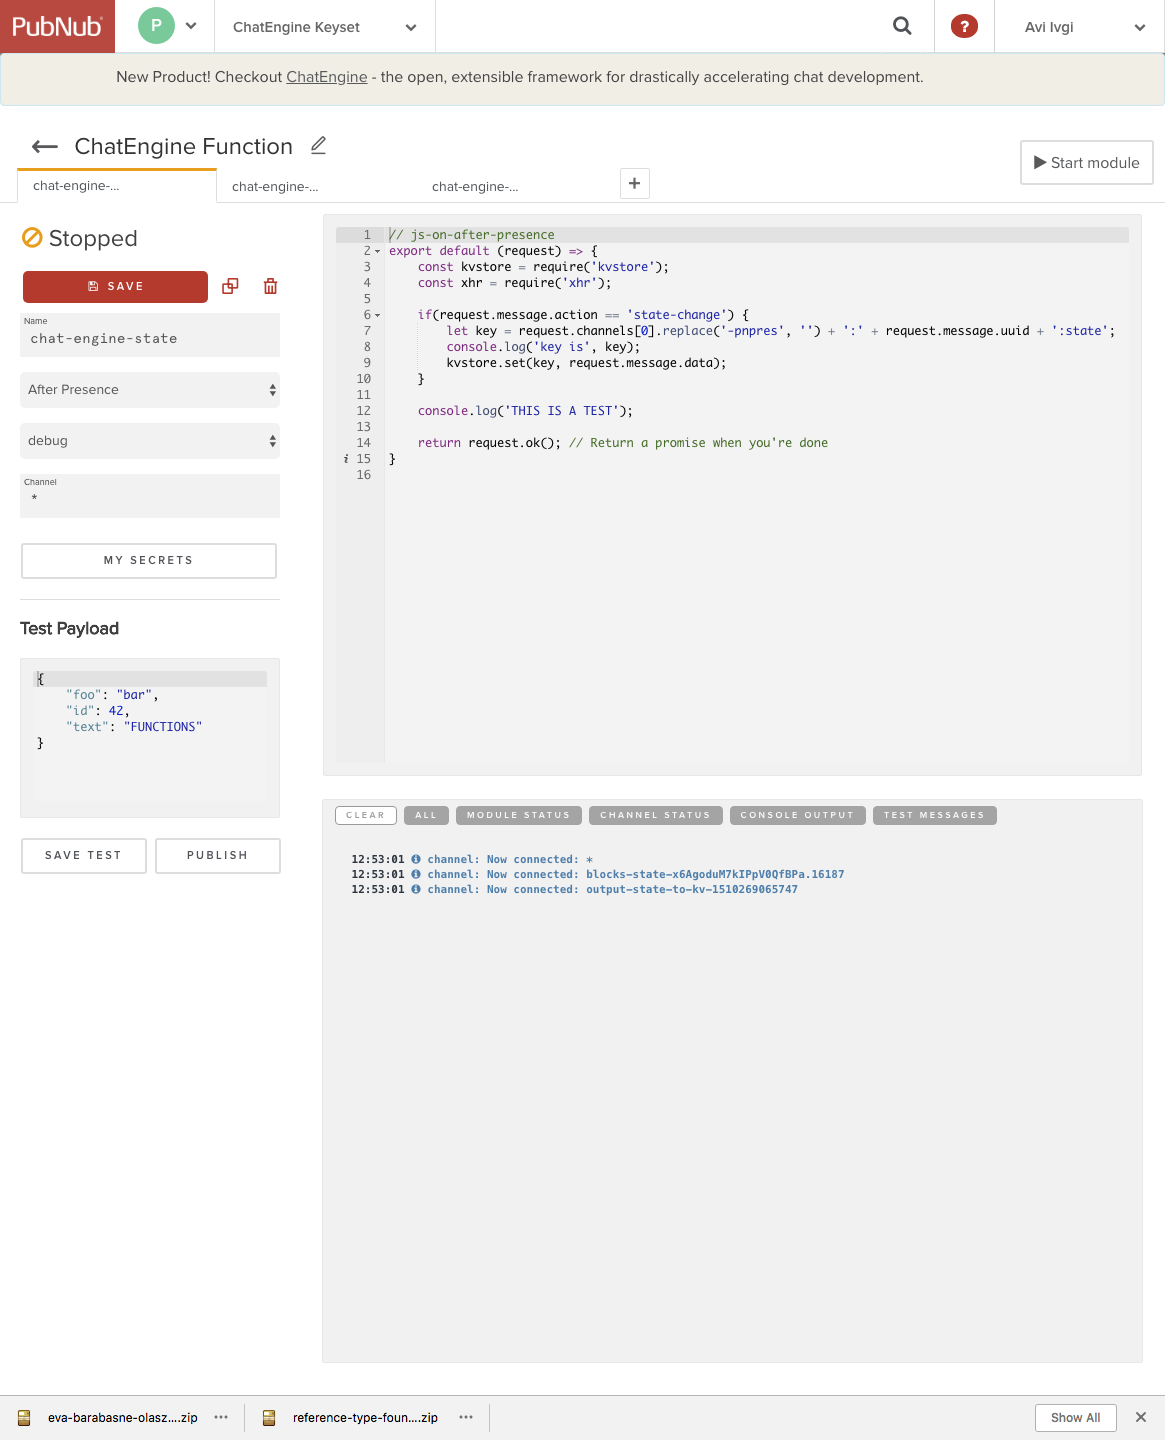
You can see in the console that we have three different channels that we connect to.
The first on is “*”, which is the same channel that the Function is listening on. The next two are a bit more unique. They are related to the hierarchy and are channels that are publishing events that are taking place and allow for the debugging. The monitoring tool subscribes to these three channels and prints out the different messages being published.
Try PubNub today!
