IN THIS ARTICLE
 Realtime dashboards and graphs are an effective way to monitor activity within organizations. For engineering teams, one of those trackable metrics are GitHub commits. This blog post will walk you through how to retrieve and display GitHub commit data in a live-updating, interactive graph.
We’ll be using PubNub to stream the commit data and C3.js to display the data. If you want to learn more about realtime C3.js charts, we have a great tutorial.
Let’s get started!
1. Add a GitHub Webhook
- Create a GitHub repository.
- Click ‘Settings’ on the right side of the page
- Click ‘Webhooks & Services’ on the left side of the page
- Click ‘Add Webhook’ in the upper right
- GitHub will prompt for your password, enter it
- Under ‘Payload URL’ enter: http://pubnub-git-hook.herokuapp.com/github/ORG-NAME/TEAM-NAME. Replace ORG-NAME with the name of your organization and TEAM-NAME with the team controlling the repo.
2. Load the Dashboard
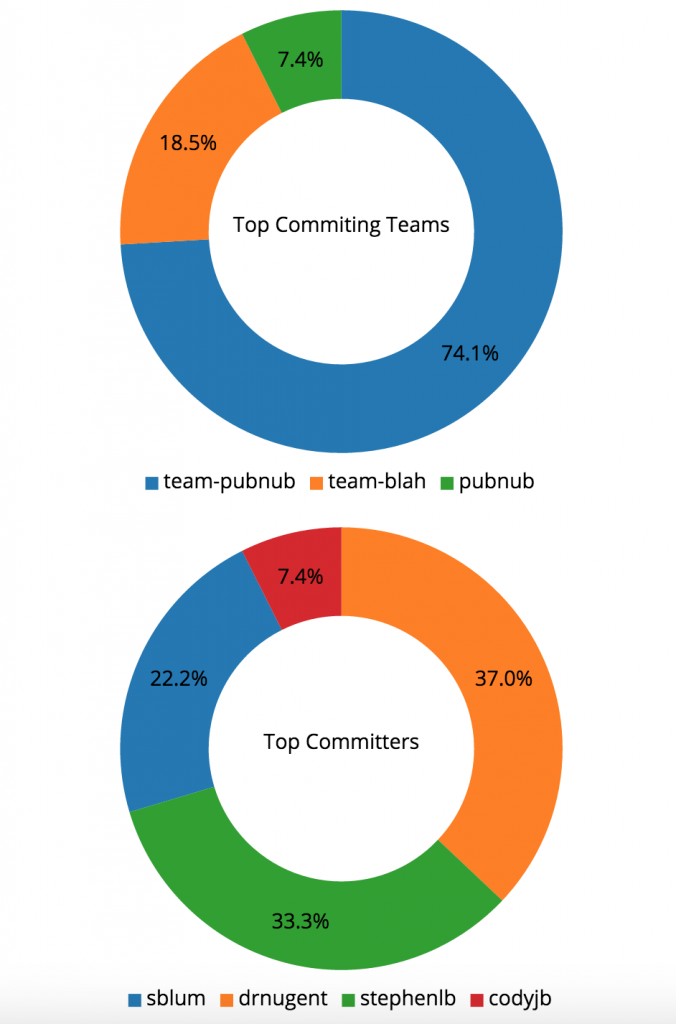
Visit this page. You’ll see a list of all the commits sent through the PubNub dashboard — sweet! When you push one of your commits to GitHub, you should see a message appear on the dashboard within a few dozens of milliseconds, and the charts will update in realtime.
If you’re going to display this dashboard in your office, we recommend filtering down the commits to your organization only. Enter the ORG-NAME from the prior step in the text area and hit enter: the dashboard will update to reflect only your organization.
3. How It Was Done
The dashboard is a mashup of GitHub, the PubNub Data Stream Network, and D3 chart visualizations powered by C3.js. When a commit is pushed to GitHub, the commit metadata is posted to a small Heroku instance which publishes it to the PubNub network. We’re hosting on dashboard page on GitHub pages.
Once our Heroku instance receives the commit data from GitHub, it publishes a summary of that data to PubNub using the public publish/subscribe keys on the channel pubnub-git. You can monitor the pubnub-git channel through our developer console here.
Here’s an example message payload:
{
  "name":"drnugent",
  "avatar_url":"
https://avatars.githubusercontent.com/u/857270?v=3
",
  "num_commits":4,
  "team":"team-pubnub",
  "org":"pubnub",
  "time":1430436692806,
  "repo_name":"drnugent/test"
}
The second half of the magic happens when the dashboard receives this information through its subscribe callback. If you look at the source of the dashboard, you’ll see this code:
This subscribe call ensures that the JavaScript function displayLiveMessage() gets called every time a message is received on the pubnub-git channel. displayLiveMessage() adds the commit push notification to the top of the log and updates the C3 visualization charts.
But wait, how is the dashboard populated when it first loads?
4. Leveraging the PubNub Storage & Playback API
PubNub keeps a record of each message sent, and provides developers a way to access those saved messages with the Storage & Playback (History) API. Deeper in the web dashboard, you’ll see the following code:
This is a request to retrieve the last 1,000 messages sent over the pubnub-git channel. So, even though the web dashboard may have been offline when those messages were sent, it is able to retrieve them and use that data to populate the dashboard as though it was permanently online.
This feature is especially useful when dealing with devices with intermittent or unreliable connectivity, such as mobile apps on cellular networks or connected cars. Thanks to the PubNub network, our visualization dashboard doesn’t require a backend to store the state of the application.
5. Building Your Own Dashboard
Feel free to fork the Git Commit UI repository to build out your own custom dashboard. The dashboard can be hosted on any static server, even your local laptop. As long as it has internet connectivity, it will receive live GitHub commit data.
Add your own charts, leaderboards, or call-outs for updates. The C3 charting library contains a plethora of different examples. I would love to see a time-series chart with realtime updates, or custom pop-ups when large groups of commits are pushed. Please reach out and share your changes, or create a pull request so we can incorporate them into our dashboard.
Good luck!


