

IN THIS ARTICLE

In this blog post, we’ll connect an Accelerometer to the Internet and stream the acceleration data in realtime to a live-updating, realtime dashboard, powered by an Intel Galileo. Accelerometers are in smartphones, rockets, navigation systems, and even structures.
Accelerometers work like this. Imagine a cardboard box with a basketball inside. Now imagine picking up the box and moving it left or right. Depending on how fast you pick up the box, the basketball may hit the roof. If you move it left or right, it’ll hit the sides.
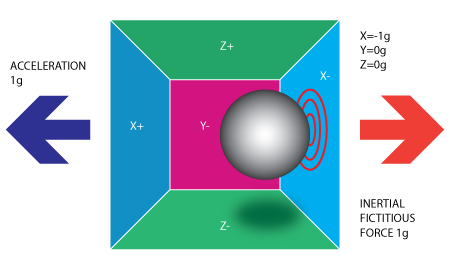
This is how an accelerometer works. The only difference is there is some component to measure the force of the ball hitting a wall. It also happens on a much smaller scale, about the size of your fingernail.
By measuring the amount of static acceleration due to gravity, you can find out the angle the device is tilted at with respect to the earth. By sensing the amount of dynamic acceleration, you can analyze the way the device is moving. At first, measuring tilt and acceleration doesn’t seem all that exciting. However, engineers have come up with many ways to make really useful products with them. Check out this article for more on accelerometers.
ADXL335 Triple Axis Accelerometer
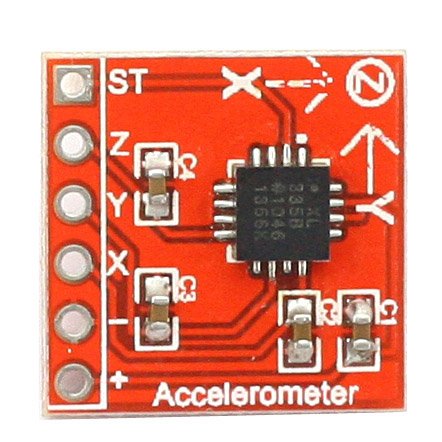
For this demo we’re going to be using the SainSmart ADXL335 Triple Axis Accelerometer. The sensor is a polysilicon surface-micromachined structure built on top of a silicon wafer. Polysilicon springs suspend the structure over the surface of the wafer and provide a resistance against forces due to applied acceleration, As described in the data sheet.
Here are some specs:
- 3-axis sensing
- Small, low profile package
- 4 mm × 4 mm × 1.45 mm LFCSP
- Low power : 350 μA (typical)
- Single-supply operation: 1.8 V to 3.6 V
- 10,000 g shock survival
- Excellent temperature stability
- BW adjustment with a single capacitor per axis
- RoHS/WEEE lead-free compliant
Tutorial Overview
- Intel Galileo Gen 2: Publishes accelerometer readings via PubNub to the dashboard.
- NodeJS: Running on the Galileo linux environment.
- PubNub: Realtime Data Stream Network that connects the Galileo to Eon-chart and streams the data in realtime.
- EON-chart: Realtime dashboard and charting framework that connects to PubNub and renders the acceleration readings in HTML (in this case, a realtime dashboard).
Intel Galileo
We’re going to use Intel Galileo; Intel’s flagship IOT prototyping chip that runs NodeJS. Check out the last post where we connected a potentiometer to Intel Galileo.
Solder the Accelerometer
First thing we need to do is solder headers to the accelerometer. Soldering headers is very simple. Just insert some headers into the provided points, touch solder to the connection, and then touch the soldering iron.
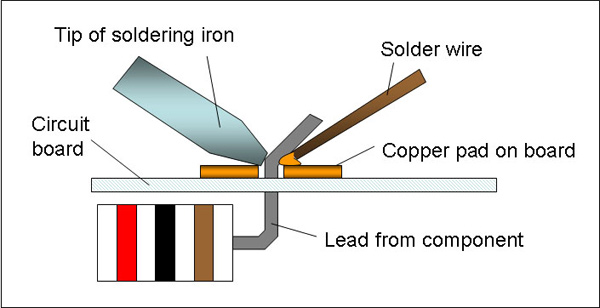
When you’re done, you’ll have an accelerometer you can plug into anything.

Wiring the Accelerometer into the Galileo
Great, now let’s wire the accelerometer. This particular device is really simple, there are 6 connections.
- ST – don’t worry about this
- Z – z axis acceleration
- Y – y axis acceleration
- X – x axis acceleration
- – – ground
- + – 3.3v power
Thanks to the header pins we just soldered, we can simply plug the accelerometer into our breadboard. Take 5 jumper cables, and wire them to each of the connections (excluding ST).

I used green for x, y, and z, red for power, and black for ground. Now plug the other ends of the jumpers into the Galileo. Note that you need to use 3.3v power and not 5v. 5v will damage your accelerometer.
| Connection | Wire Color | Galileo Pin |
|---|---|---|
| Z | Green | A0 |
| X | Green | A1 |
| Z | Green | A2 |
| – | Black | GND |
| + | Red | 3.3v |
Here’s what mine looked like when I was done connecting everything:

Node.js
Now we’re going to read the accelerometer data using Node.js and publish it via PubNub Data Streams so we can display it in realtime on our dashboard. Load the Intel XDK and start with a blank project.
If you need help setting up your Galileo, check out the beginning of our post on connecting a potentiometer to the Galileo.

Package.json
In the package.json add PubNub as a dependency:
Then click Install/Build. This essentially runs npm install on your Galileo and adds the PubNub library to your build. PubNub is the backend for this demo; it allows us to publish the accelerometer data to the internet and read it somewhere else.
We can read the accelerometer data using analog read. We’ll assign the values to x, y, and z within our javascript file.
Next, we’ll create a loop to continually read the values of the X, Y, and Z accelerations. In the following case, we store the initial values as a “zero” value and then calculate the difference.
Integrating PubNub
Now let’s integrate PubNub for the realtime streaming of the accelerometer data.
The channel is the name of the room for which we’ll subscribe to messages on the other end. The message is formatted like so because it matches the schema defined in eon-chart.
If everything is working, you should see the value of the accelerometer output on the PubNub Developer Console here. Try moving the accelerometer around and watch as the value output changes. That data is being streamed over PubNub.
Now to render that data on our realtime dashboard.
Receiving and Visualizing the Data on a Dashboard
Now to create an HTML webpage to render the realtime dashboard. We include the eon framework in the head of the page, and that’ll take care of connecting to PubNub and creating our chart. Easy huh?
Create the chart with the following function. We supply the same PubNub channel the Galileo is broadcasting from (pubnub-intel-gal-demo-xyz) and render the data in a bar type chart. EON-chart subscribes to that PubNub channel, renders the chart, and updates it when the value changes.
Try it out! Load this page up in Chrome and move your accelerometer around.
That’s it! Now you’re Galileo is broadcasting it’s information over the internet (via PubNub) and into a webpage. You’re probably loading the page locally, but it can be hosted anywhere and it’ll still work all the same.
Wrapping Up
You can extend this demo by adding more charts, more analog inputs (a potentiometer, buttons, light sensors, etc), or even adding more microcontrollers. You can even use PubNub to allow one Galileo to talk to another Galileo, or command them all from a centralized control panel!
If you want to learn more about all the things you can do with the EON framework and PubNub, check out the video below!
Try PubNub today!


