IN THIS ARTICLE
The core of IoT monitoring is streaming readings from a sensor (or network of sensors) to a realtime dashboard as the data changes. To do this, we need a data stream network to publish the data from the sensor, and a live-updating dashboard to subscribe to the readings and display them in realtime.
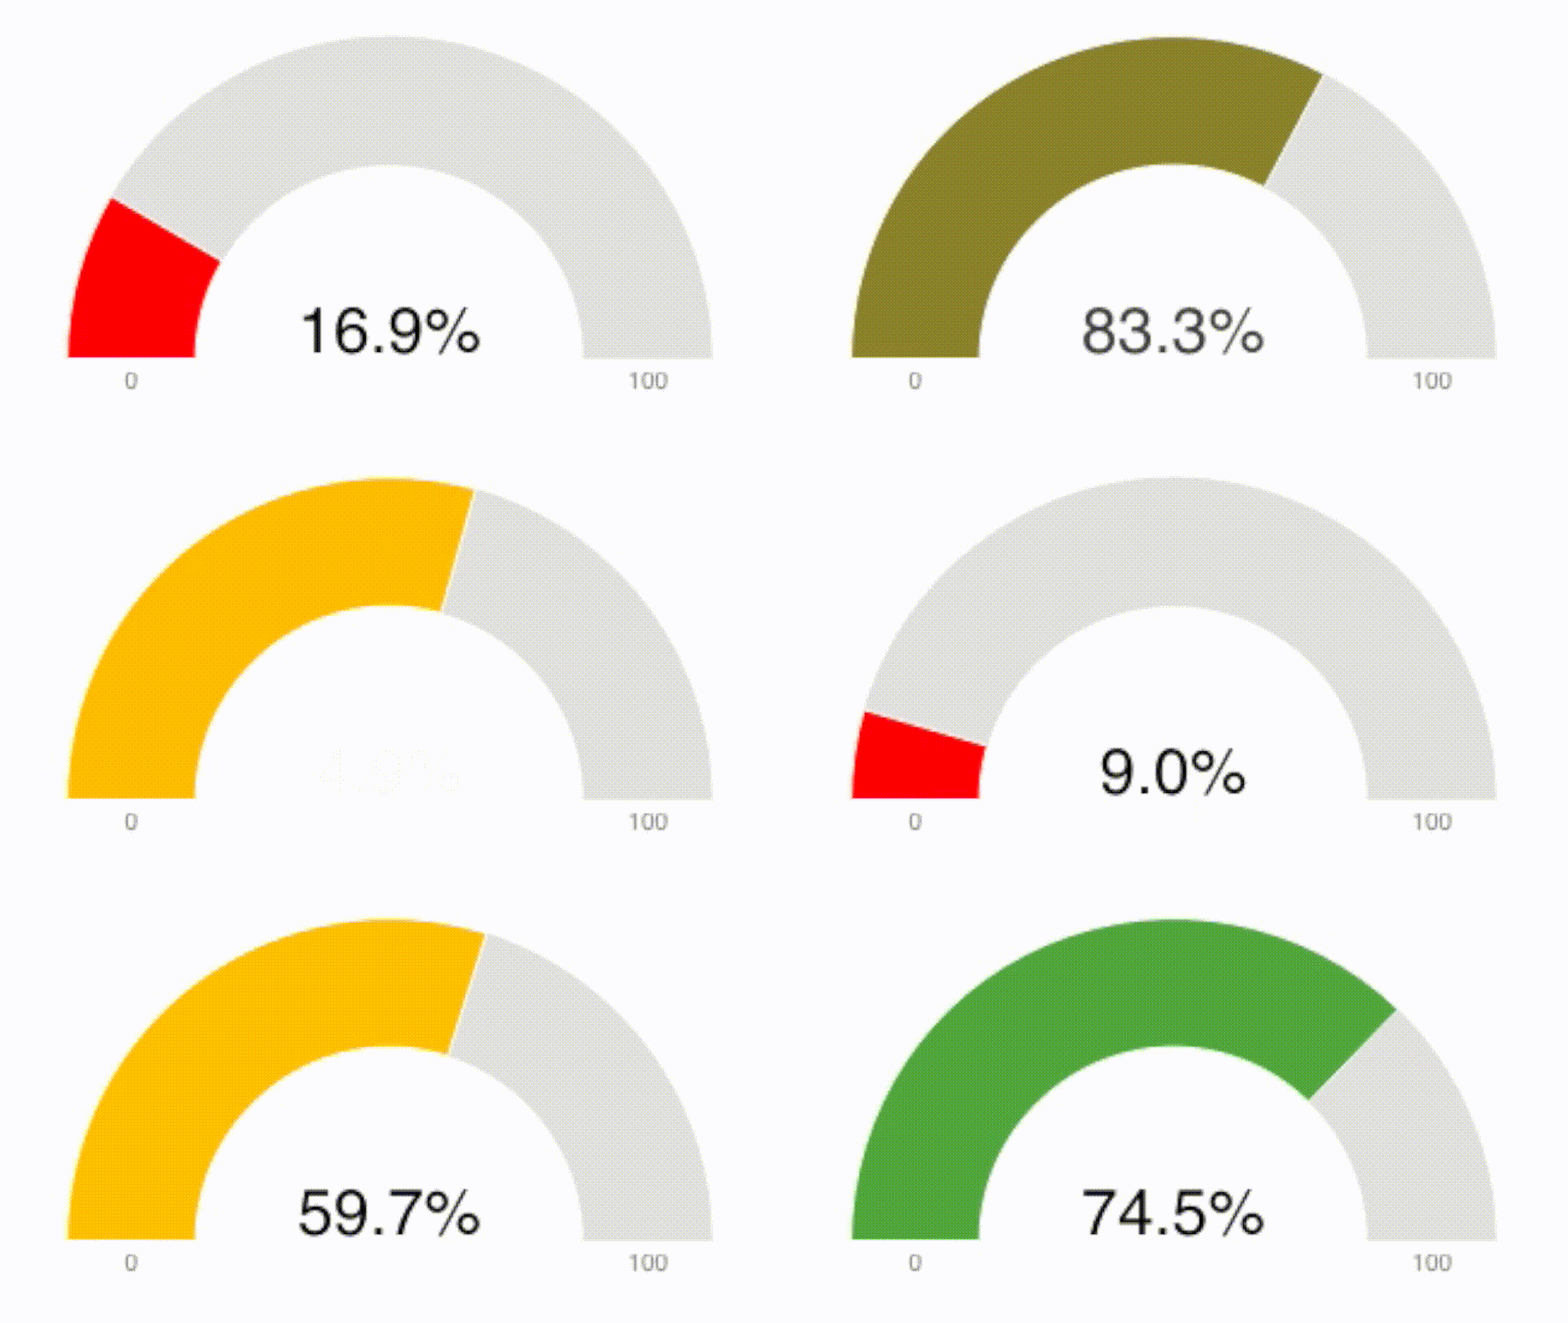
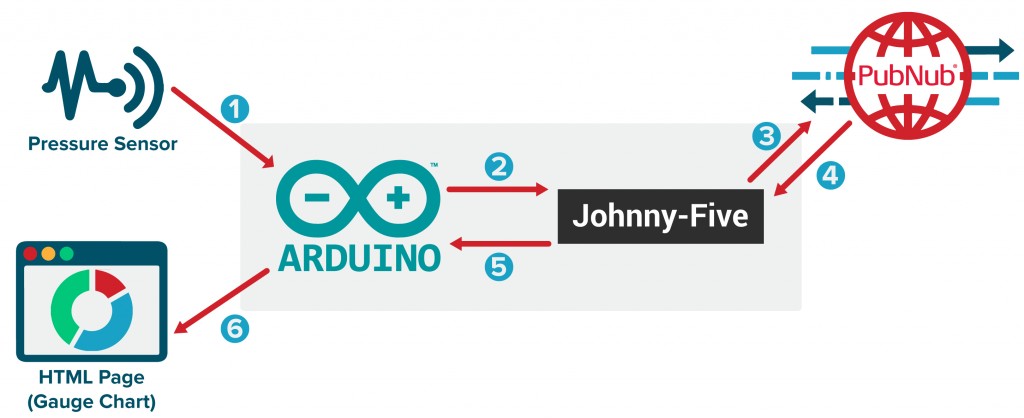
In this post, we’re going to collect pressure data with a sensor, and stream that data to a realtime dashboard; in this case, visualizing the data as a realtime gauge chart. We’ll run the pressure sensor on an Arduino board, and the EON JavaScript framework to visualize the readings as a gauge chart.
In the video below, we give a live demonstration of the application in-action, as well as a code walkthrough. Now, let’s get to coding!
IoT Gauge Chart Resources
Server Side – Collecting Readings
First, create a JavaScript file app.js Then, install two npm packages. These two packages will be installed globally.
npm install pubnub -g
npm install johnny-five -g
Inside the JavaScript file, first mention the packages required and the variables needed.
Here, we have required both the Johnny-Five and PubNub packages. In the pubnub variable, input your unique publish and subscribe keys.
Then we initiate the Arduino:
Here, ‘five’ has a board module, where inside we set up the sensor on pin ‘A0’ which will collect the readings every 1000ms. You can read more about the board component initialization and usage here, as well as the Johnny-Five sensors’ APIs here.
Once everything is set up, we can start sending and receiving the events (ie. the pressure sensor readings).
Here, set the scale of readings that we get from sensor as the range of 0 to 10. Whenever EON receives the data, we convert it into two digit decimals, and then we publish that reading to ‘pubnub-eon-iot’ channel. Inside the message, we have a columns array. Inside that columns array, we have just one array.
The first element is by default ‘data’. And second element is the data we are getting from the sensor and passing to channel.
With that, the serve side is ready. Here’s the full code.
Client Side – Gauge Chart
For this tutorial, our client side will be a single HTML file that displays the gauge chart.
Here’s what our HTML looks like:
Inside a basic HTML template, add the JavaScript and CSS file for EON charts through the PubNub CDN:
Then add a div with id ‘gauge’ inside the body where we will add the chart. Just after <body>, we added the JavaScript tag which will receives the data from PubNub channel and adds it to HTML.
Receiving Data with EON
‘eon.chart’ returns a C3 chart object. We supplied the PubNub channel name to the channel parameter. Inside ‘generate’ parameter, we mention where the chart will be coming in the bindto parameter as the id or class of the HTML tag where it will be put (i.e. #gauge).
In the data object, we only have to specify the type, i.e. gauge. It will be automatically bound to the data parameter of the columns on the server side. This provides us another object called ‘gauge’ where we set the minimum and maximum value of the gauge. We can also define the color pattern it should display on the gauge when a particular value is crossed.
Running the Program
To run this program, you have to push the Standard Firmata file from the Arduino IDE to your board first and then run ‘node app.js’. Open the index.html in the browser. With that, we’re now streaming live pressure data from the Arduino to our live gauge chart.

Realtime Visualizations
We have a ton of other ways to display IoT sensor data, all using EON, our new JavaScript framework for realtime dashboards, charts, and maps. EON plays nicely with a wide variety of boards, including Raspberry Pi, Arduino, Atmel, and Texas Instruments (and all their sensor modules), and offers a number of different types of charts. Even better, EON is built for scale, so feel free to stream from any number of channels to create robust, beautiful dashboards.
To learn more about EON and its use cases, watch the video below.


